🌍 Public
ICE - 7 Pie_Chart
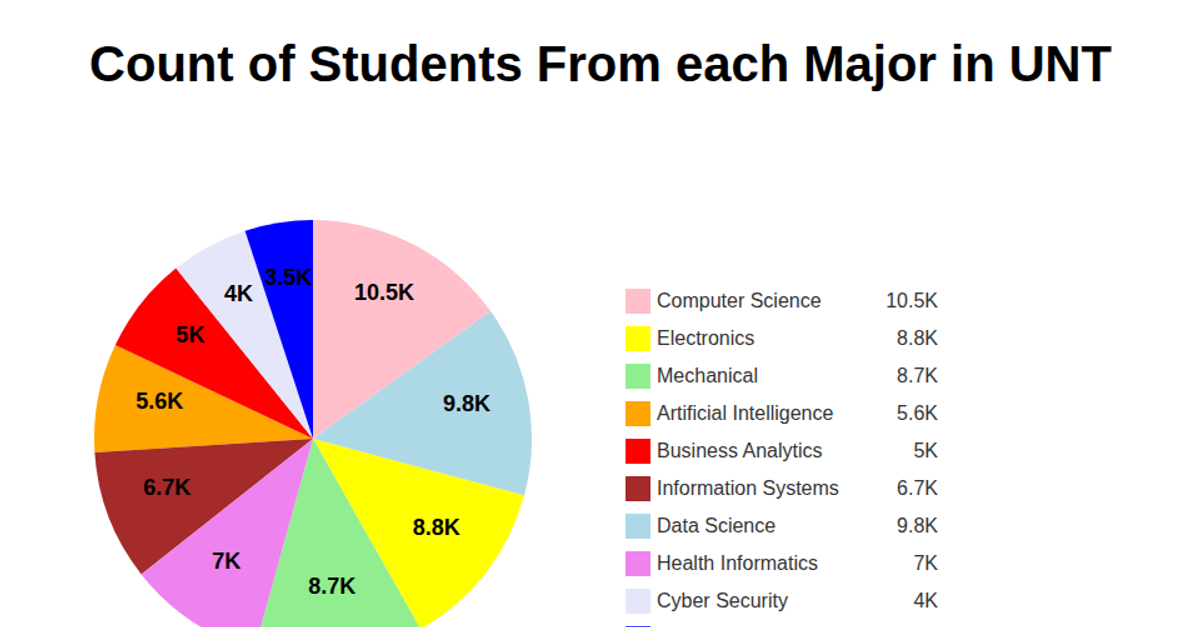
This pie chart visualizes the distribution of students across academic majors at the University of North Texas. Each slice represents a major with its size proportional to the student count. The chart uses D3 v5 APIs including `pie()`, `arc()`, `scaleOrdinal()`, and text labels showing values in thousands, with a color-coded legend. The data is fetched from a CSV hosted on GitHub and rendered as SVG.
AI-generated descriptionMIT Licensed




Comments
Sign in to join the discussion.