🌍 Public
vyjayanthi2
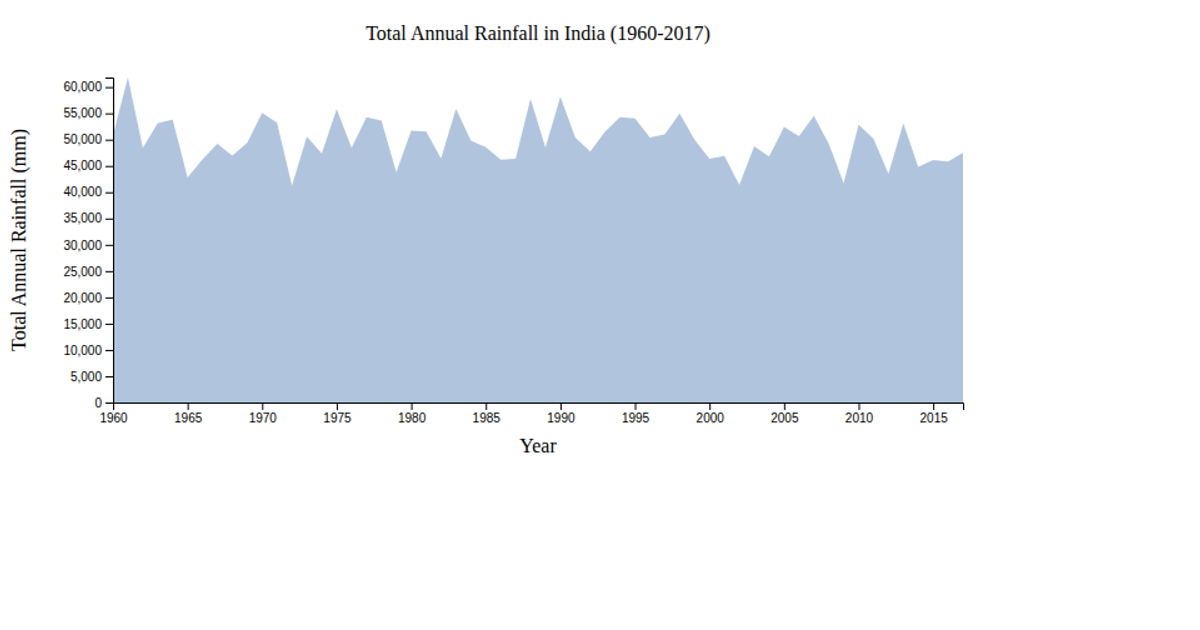
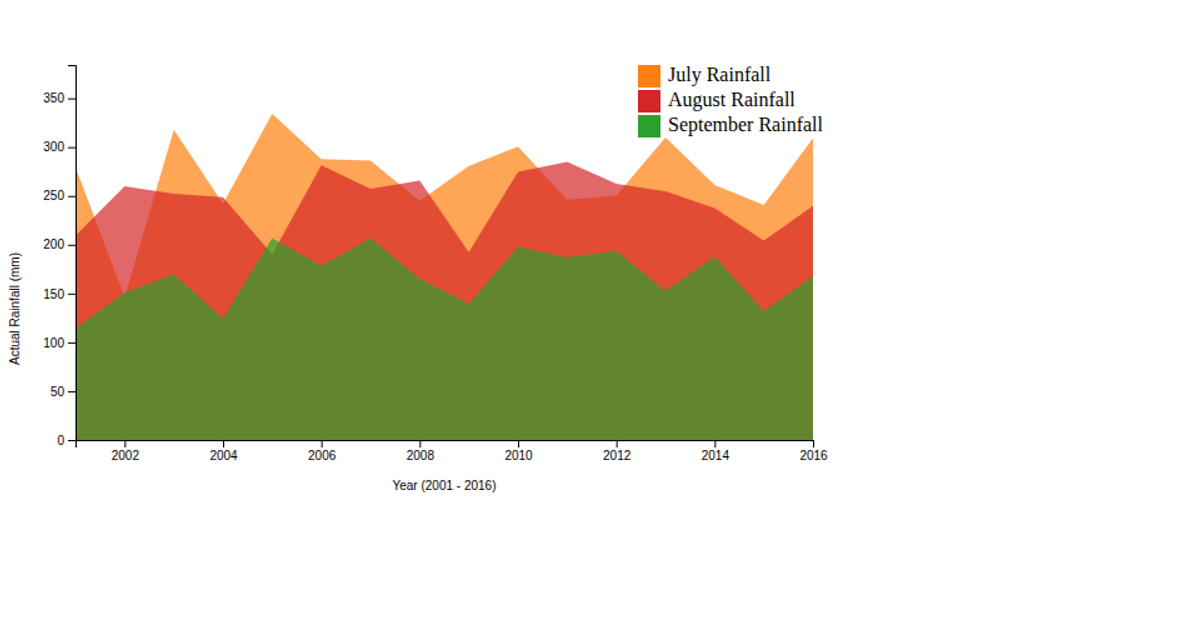
This area chart displays average monthly rainfall for ten global cities, using a steelblue filled polygon and red circular data points. The visualization employs D3 v7's area generator, point-scale, and linear-scale APIs to map city names to x-coordinates and rainfall values to y-coordinates. An interactive tooltip appears on hover, showing the city name and rainfall in millimeters. The chart includes rotated x-axis labels for city names and axis labels for both dimensions.
AI-generated descriptionMIT Licensed





Comments
Sign in to join the discussion.