🌍 Public
niteesh_dv6
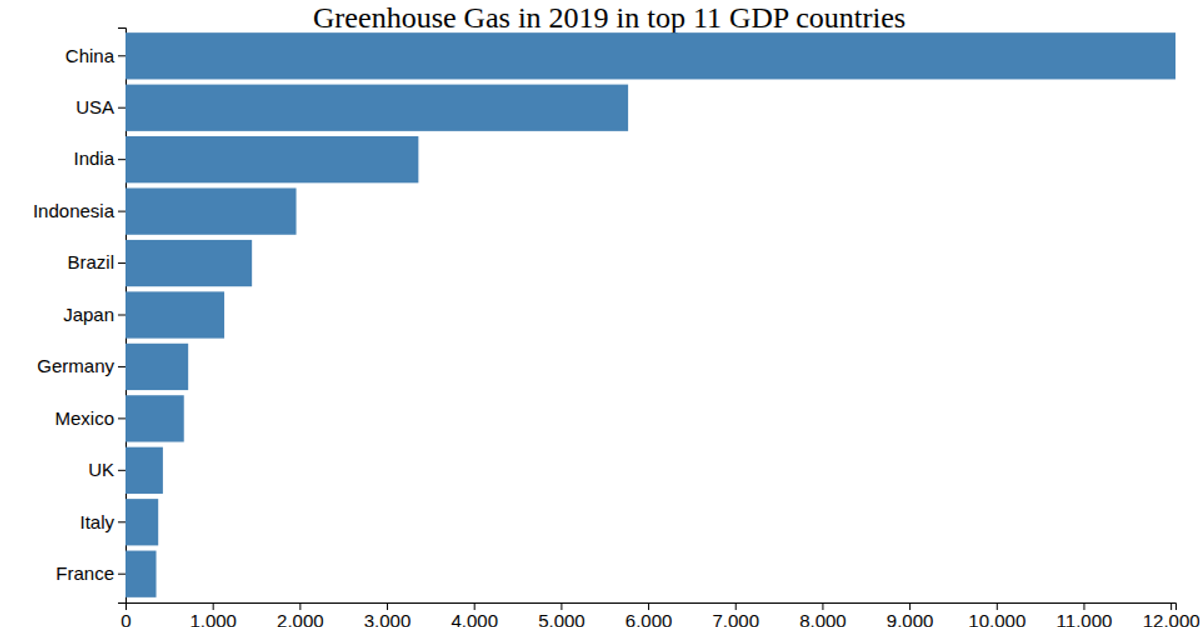
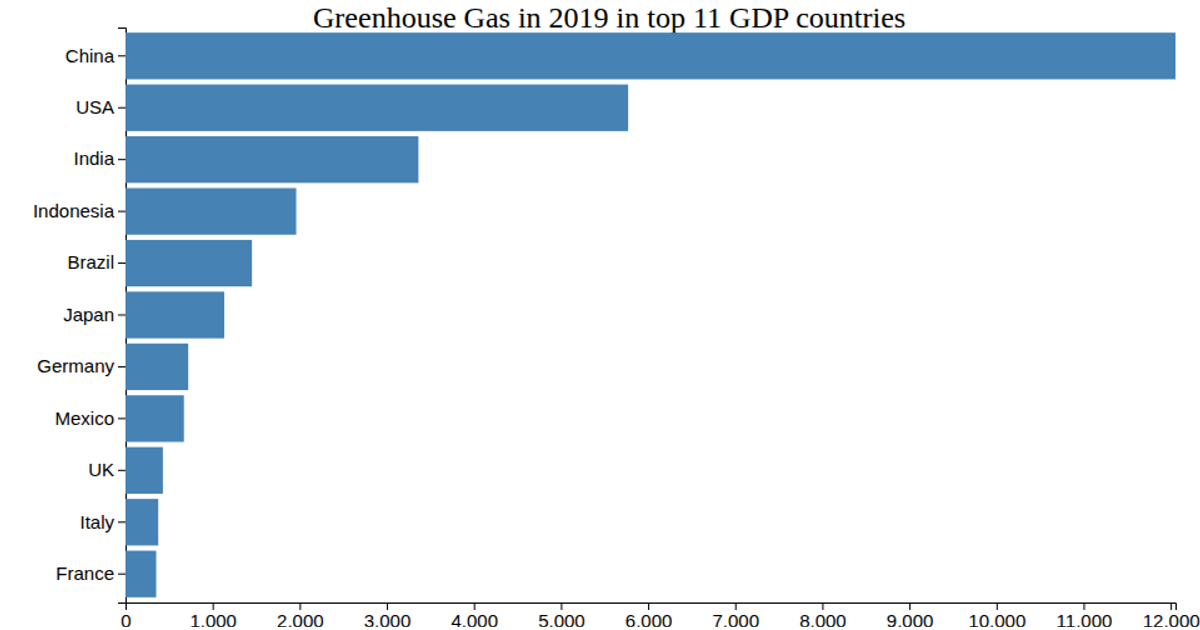
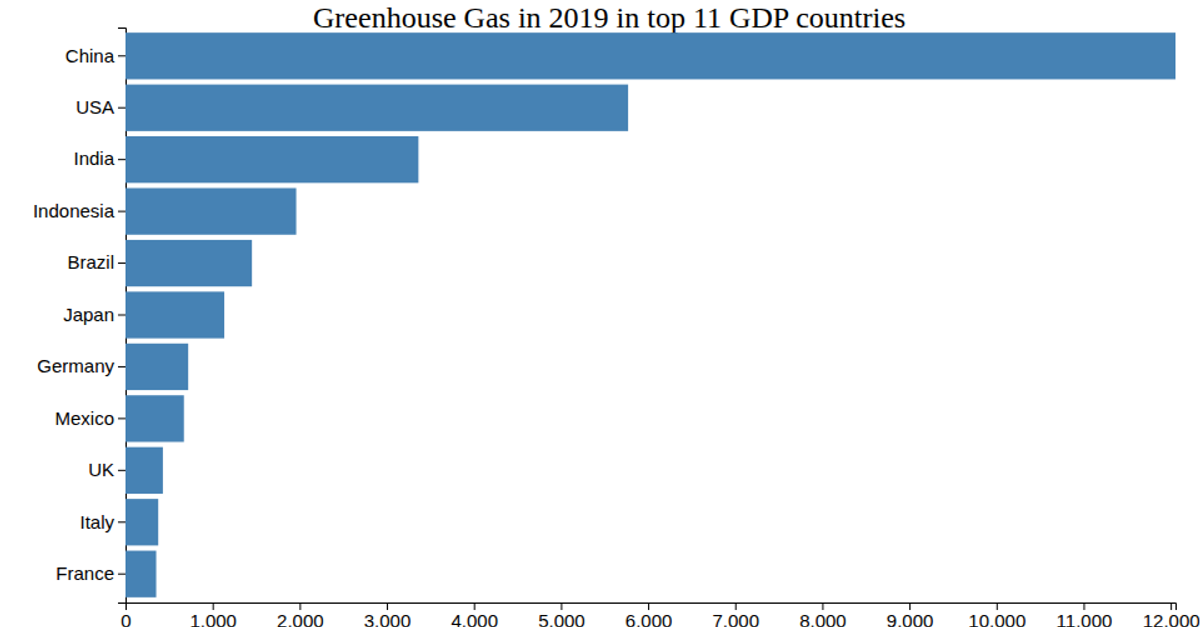
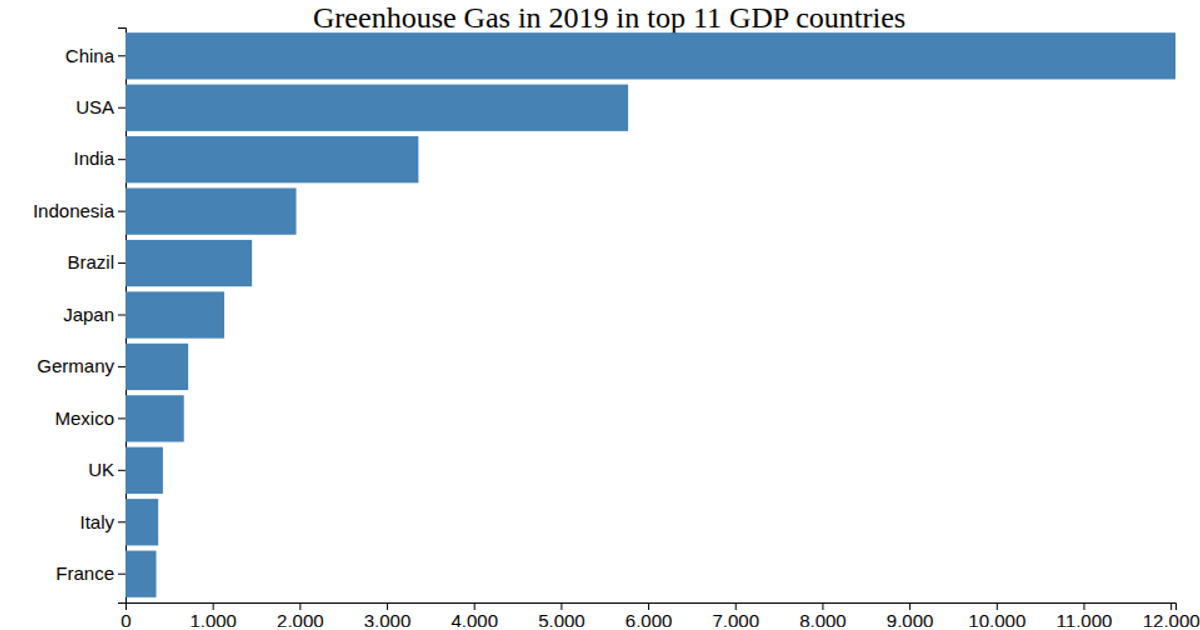
This bar chart displays greenhouse gas emissions in 2019 for the top 11 GDP countries, using horizontal bars sorted by population. It loads data from a CSV file and renders with d3.v7, employing `scaleLinear` for the x-axis, `scaleBand` for the y-axis, and `axisBottom`/`axisLeft` for ticks. Interactive tooltips appear on mouseover via d3 event handlers, and bars change fill color through a custom `shadeColor` function. The visualization uses SVG with animated hover effects.
AI-generated descriptionMIT Licensed




Comments
Sign in to join the discussion.