🌍 Public
Fork of Basic Scatter Plot with React & D3
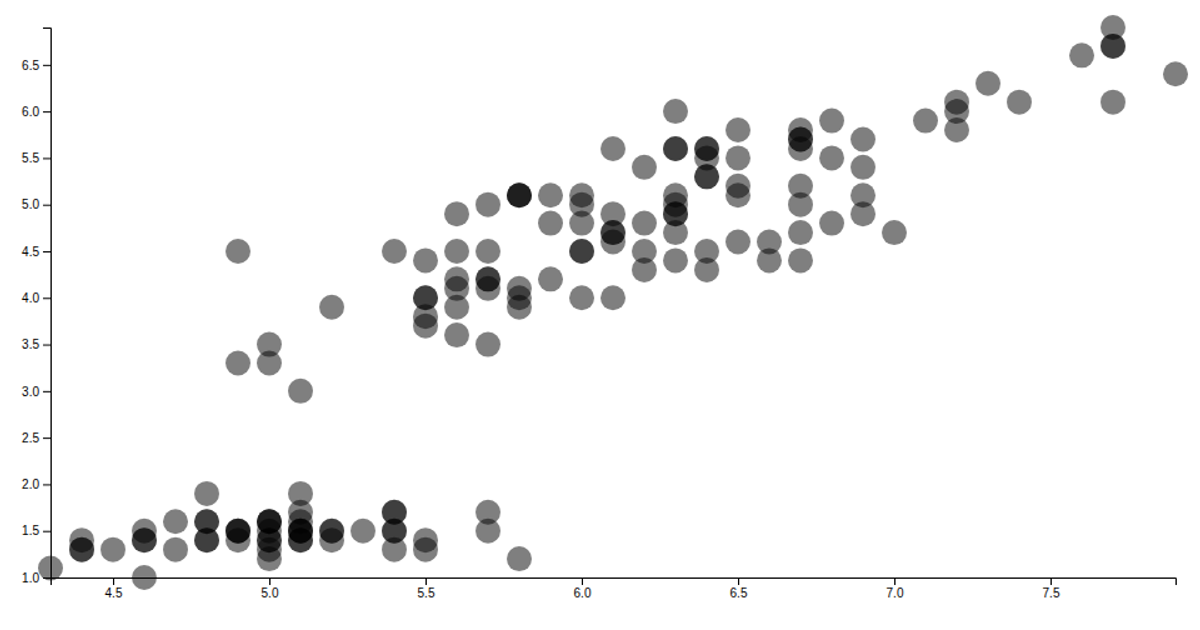
A React component renders a scatter plot of Fisher's Iris dataset, mapping sepal length to the x-axis and sepal width to the y-axis. The SVG circles are uniformly sized and black, with no species distinction. The App loads the CSV via d3.csv, converts numeric fields, and passes data to a viz function that uses d3.scaleLinear and d3.extent to compute scales before joining circles with selectAll and join.
AI-generated descriptionMIT Licensed



Comments
Sign in to join the discussion.