🌍 Public
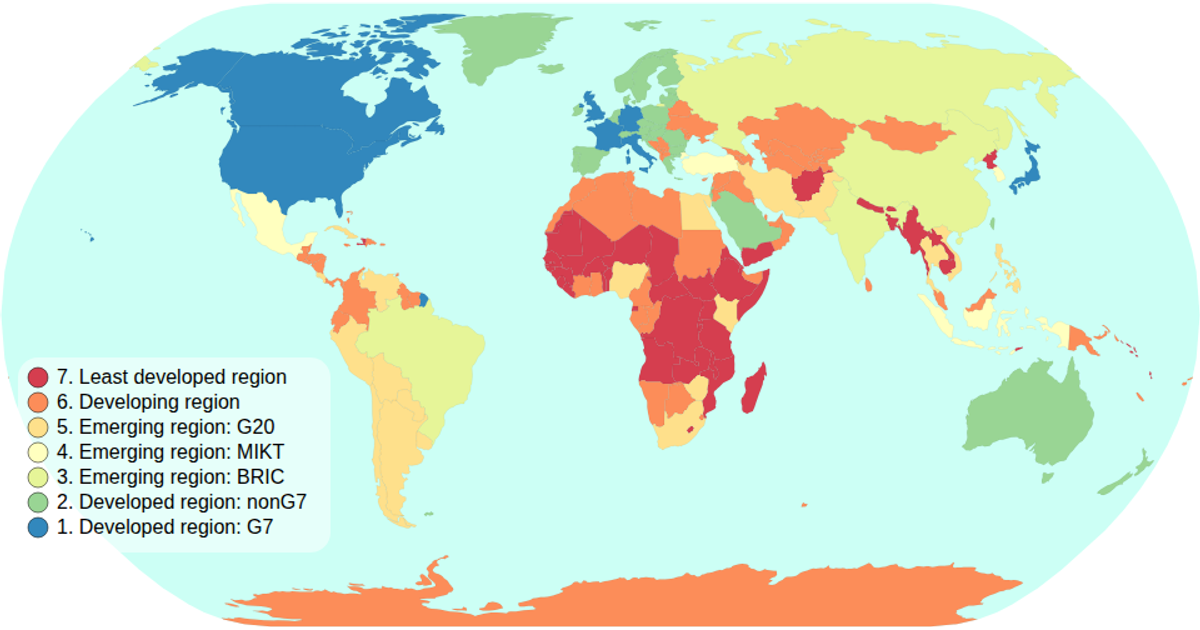
Choropleth Map - with interactive filtering
This choropleth map displays global economic classifications, coloring each country with an ordinal spectral scale based on its economy attribute. The visualization includes an interactive legend where clicking a category filters the map, dimming non-matching countries and highlighting selected ones. Built with React and D3 v5, it uses `geoPath` and `geoNaturalEarth1` for map projections, supports zooming via the `zoom` API, and loads country boundaries and data from the world-atlas package. The legend is interactive, with click handlers and animated transitions.
AI-generated descriptionMIT Licensed



Comments
Sign in to join the discussion.