🌍 Public
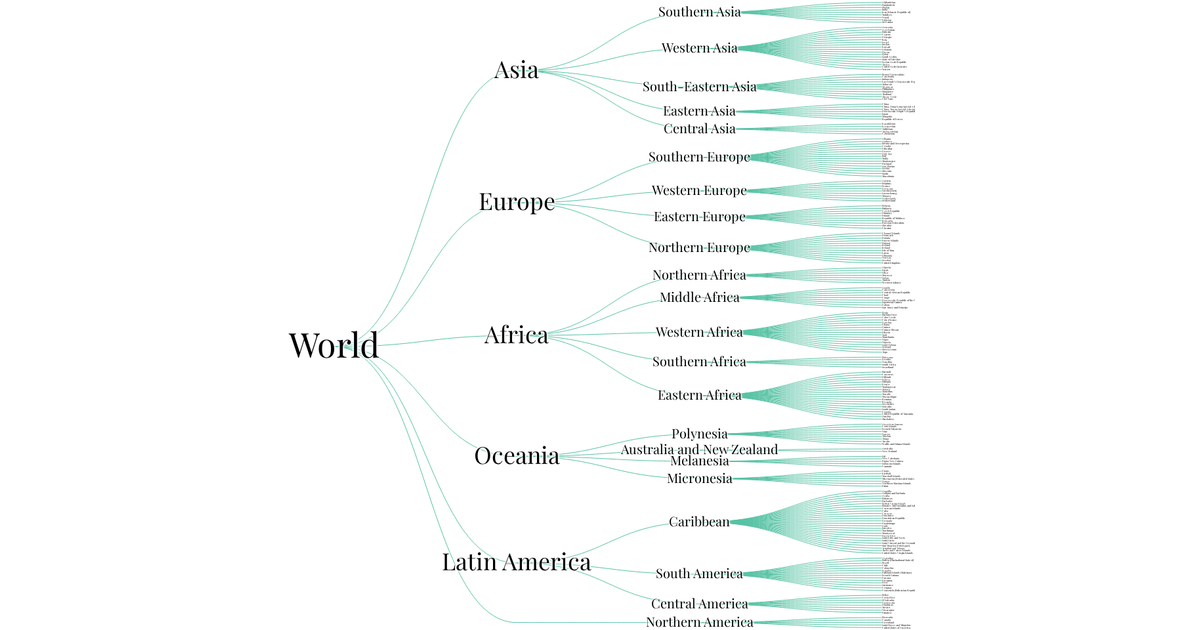
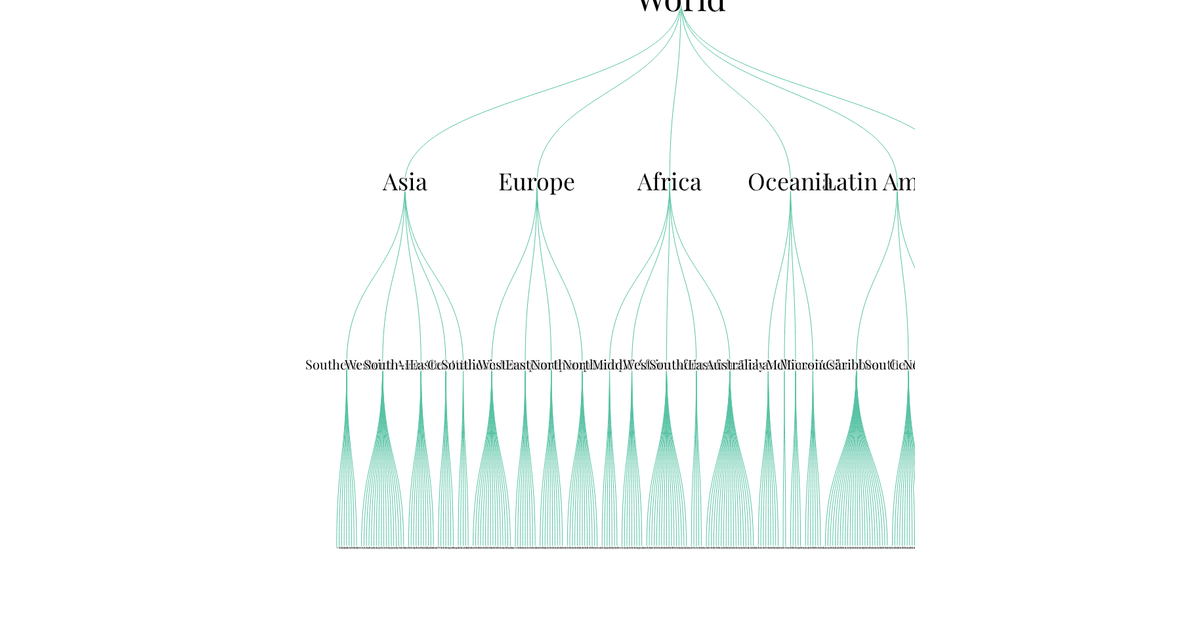
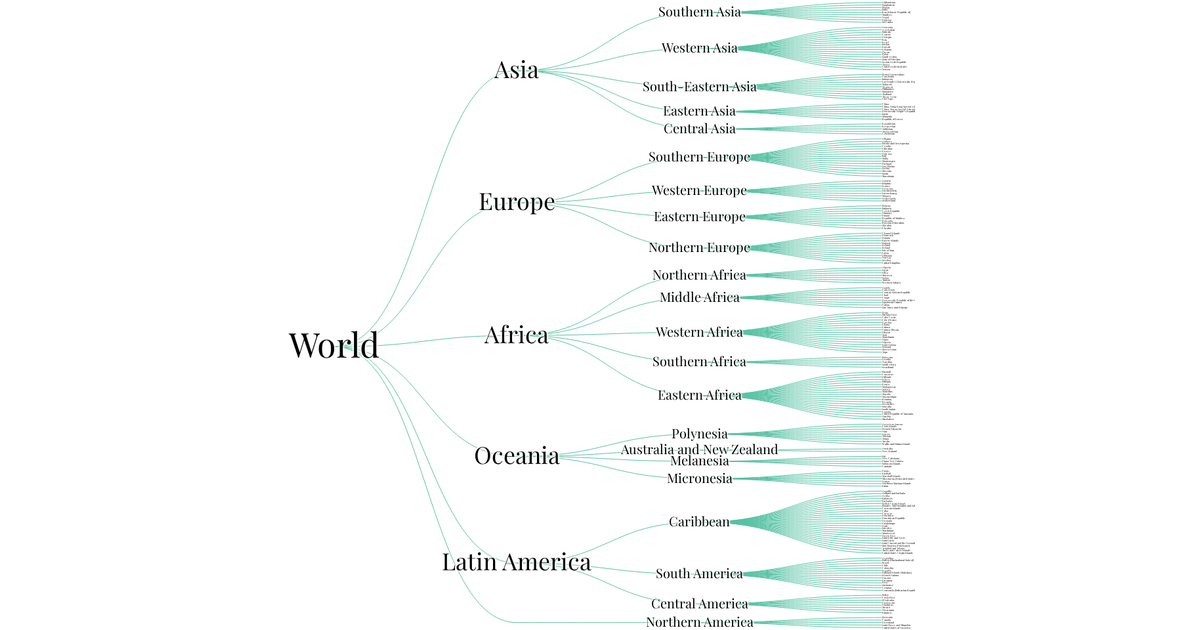
Fork of World Countries Tree
This data visualization displays a hierarchical tree of Chinese academic research topics, rendered as an interactive SVG diagram. It uses the D3.js library to create a horizontal dendrogram layout, leveraging `tree()`, `linkHorizontal()`, and `zoom()` APIs for structuring, connecting, and enabling pan/zoom interactions. Node labels reflect the Chinese document outline from a JSON data source, with font size decreasing by depth. The visualization clearly maps the multi-level relationships between research areas.
AI-generated descriptionMIT Licensed


Comments
Sign in to join the discussion.