🌍 Public
New line chart
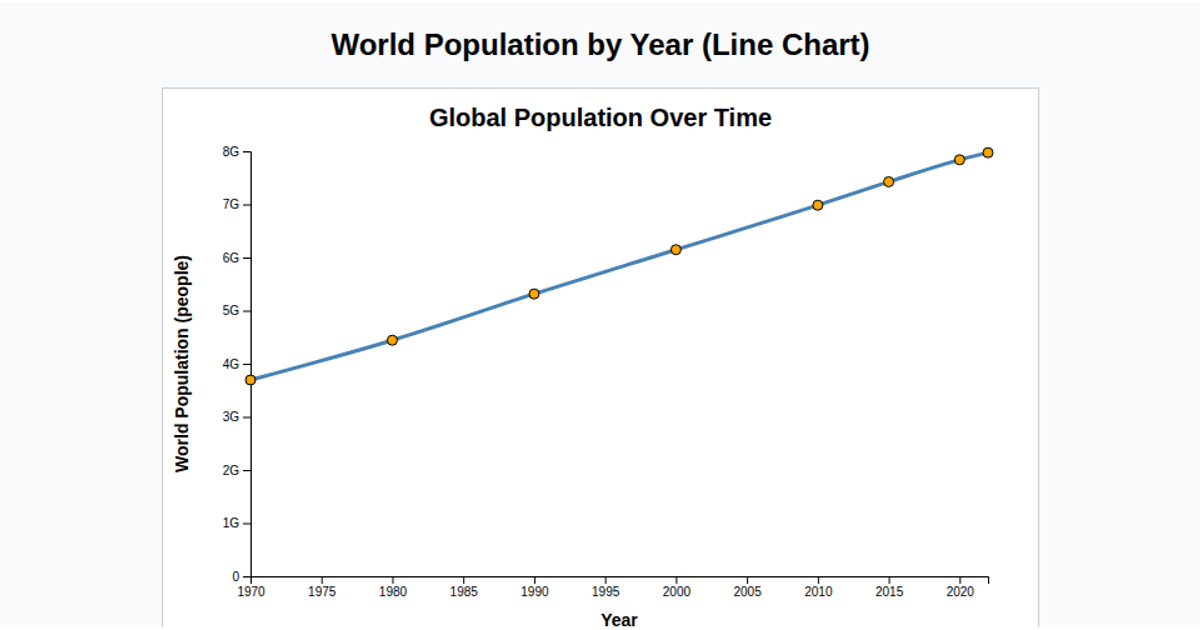
This visualization displays Finland’s population data from 2018, comparing the number of live births and deaths per thousand people over time. Two smoothed line paths represent the two metrics, colored to distinguish them. A color legend identifies the series, while axis labels and a title provide context. The chart is built with D3 v5, using `scaleUtc` and `scaleLinear` for scaling, `curveBasis` for line smoothing, and SVG for rendering. Data is loaded from a CSV file, with both metrics divided by 1000 for readability.
AI-generated descriptionMIT Licensed




Comments
Sign in to join the discussion.