🌍 Public
Fork of Vega-Lite API Template
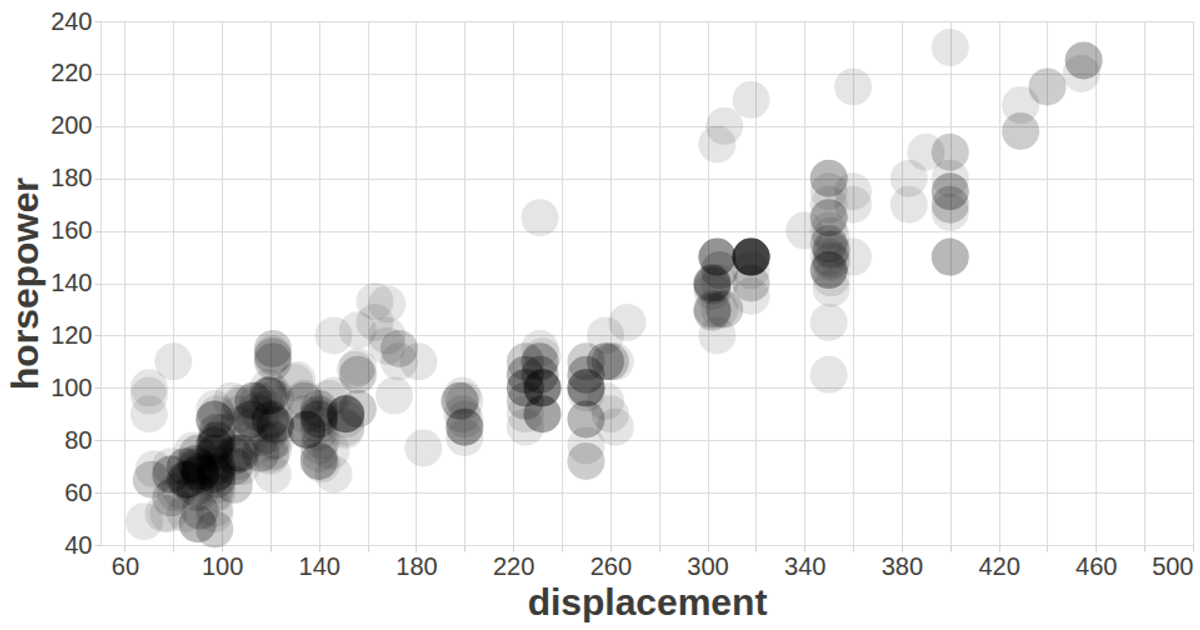
This scatterplot visualizes the relationship between engine displacement and horsepower for a car dataset loaded from a CSV file. The example uses the Vega-Lite API, a JavaScript wrapper for Vega-Lite, to declaratively define the chart, with `vl.markPoint` for the points and `vl.x()` and `vl.y()` encoding quantitative fields. Rendering occurs through Vega, with the chart sized to the window and tooltips enabled via the Vega Tooltip handler. The code also imports custom axis and label styling from a separate config module.
AI-generated descriptionA visualization constructed using the vega-lite-api.
MIT Licensed


Comments
Sign in to join the discussion.