🌍 Public
Activity 6 task 1
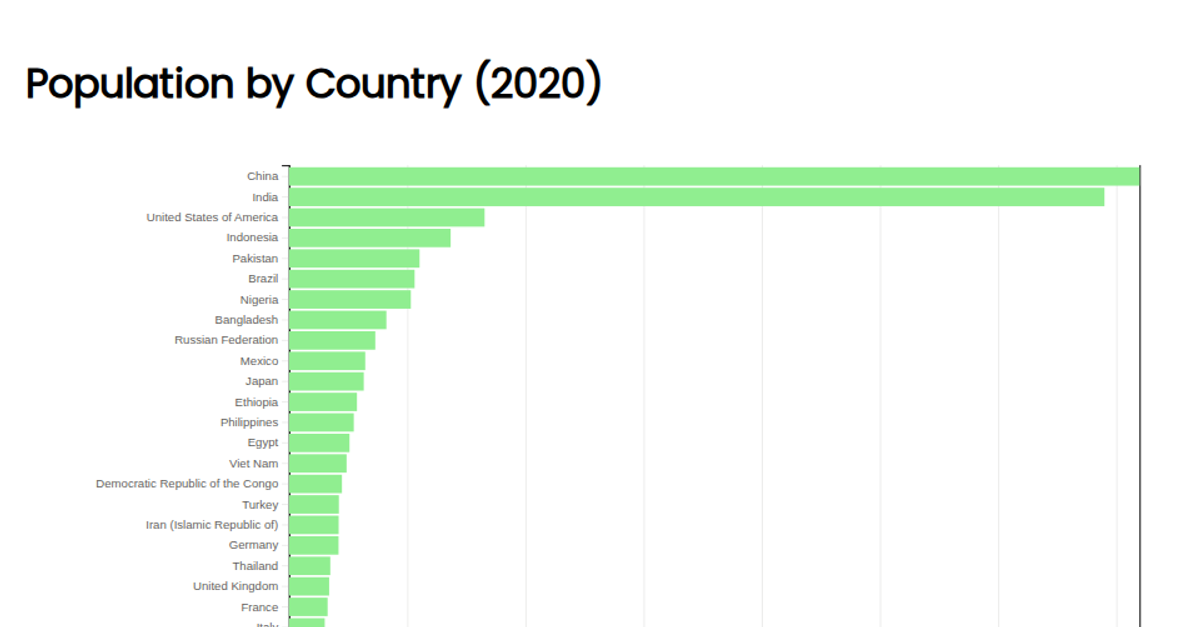
This example presents a horizontal bar chart showing the population of various countries, using data from a CSV file from a GitHub gist. The visualization is implemented in JavaScript with D3, where the x-axis uses a linear scale and the y-axis uses a band scale. The bars are drawn as SVG rectangles with a steelblue fill, and each bar is labeled with its population value. The chart includes left and bottom axes, created using `axisLeft` and `axisBottom`, and the code uses dynamic scaling and margin calculations to position the visualization.
AI-generated descriptionMIT Licensed





Comments
Sign in to join the discussion.