🌍 Public
Assignment 2 6q
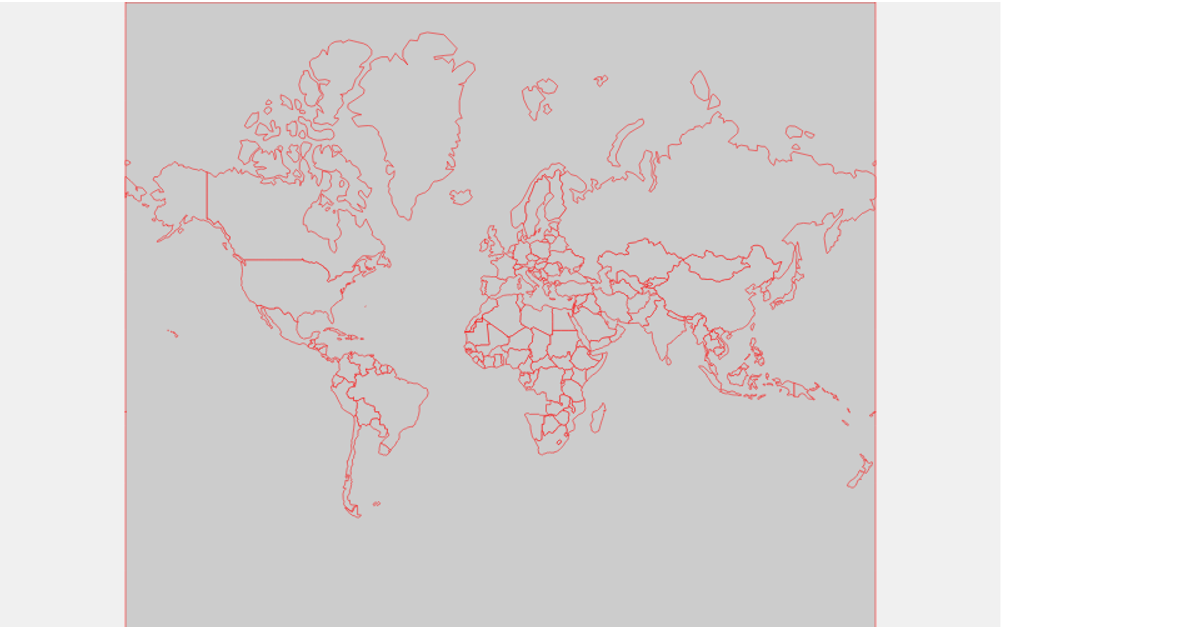
This visualization displays a map of Uruguay using a transverse Mercator projection, with each country region filled in red and outlined in black. The map is rendered as an SVG using D3.js version 5 and TopoJSON to decode geographic data from a GitHub gist. Users can zoom and pan the map via the `d3.zoom` interaction, which applies transformations to the map group. Hovering over a region triggers a CSS transition that changes its fill color to maroon, enhancing interactivity.
AI-generated descriptionUruguay Map-Topojson
MIT Licensed




Comments
Sign in to join the discussion.