🌍 Public
Network Graph--Fouzan
Ffouzanuddin
Last edited Apr 5, 2022
Created on Apr 5, 2022
Forked from ICE - 8 Network Graph of Friends (11508271)
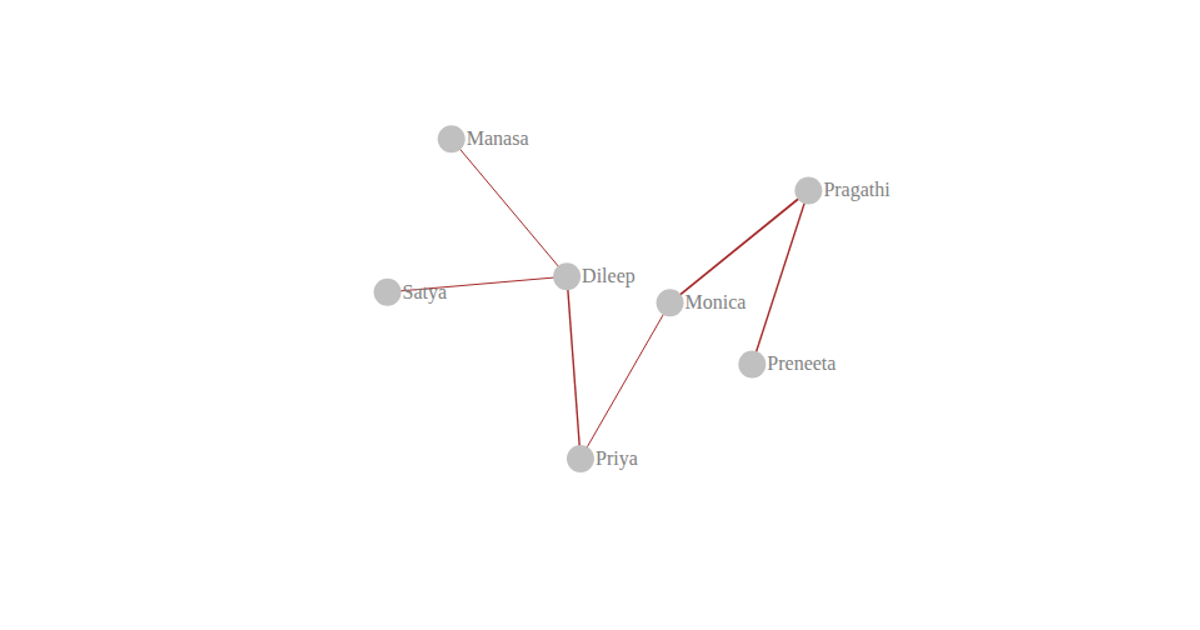
A network graph displays seven people connected by weighted links, with node sizes and link thickness reflecting the weight values from a JSON file. The visualization uses D3 v4’s force-directed layout, with nodes rendered as red circles and labeled with names. Users can click and drag nodes to reposition them, while the simulation updates positions continuously. The graph employs SVG elements for links and nodes, with link stroke width scaled by the square root of each connection’s weight.
AI-generated descriptionMIT Licensed




Comments
Sign in to join the discussion.