🌍 Public
Performance Spectrum
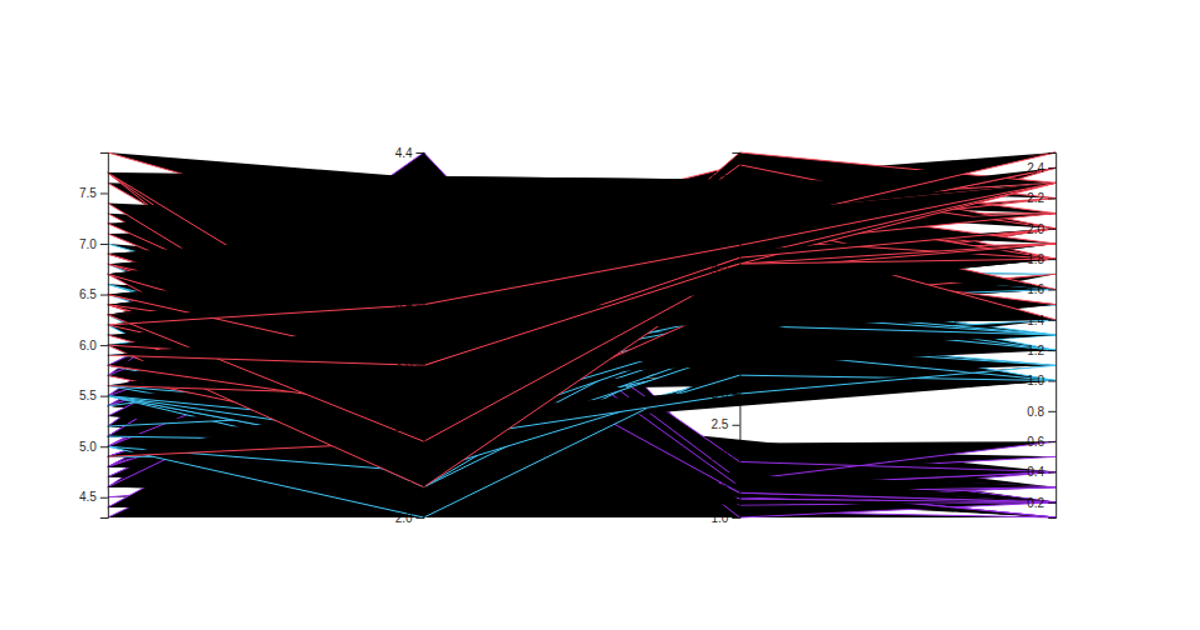
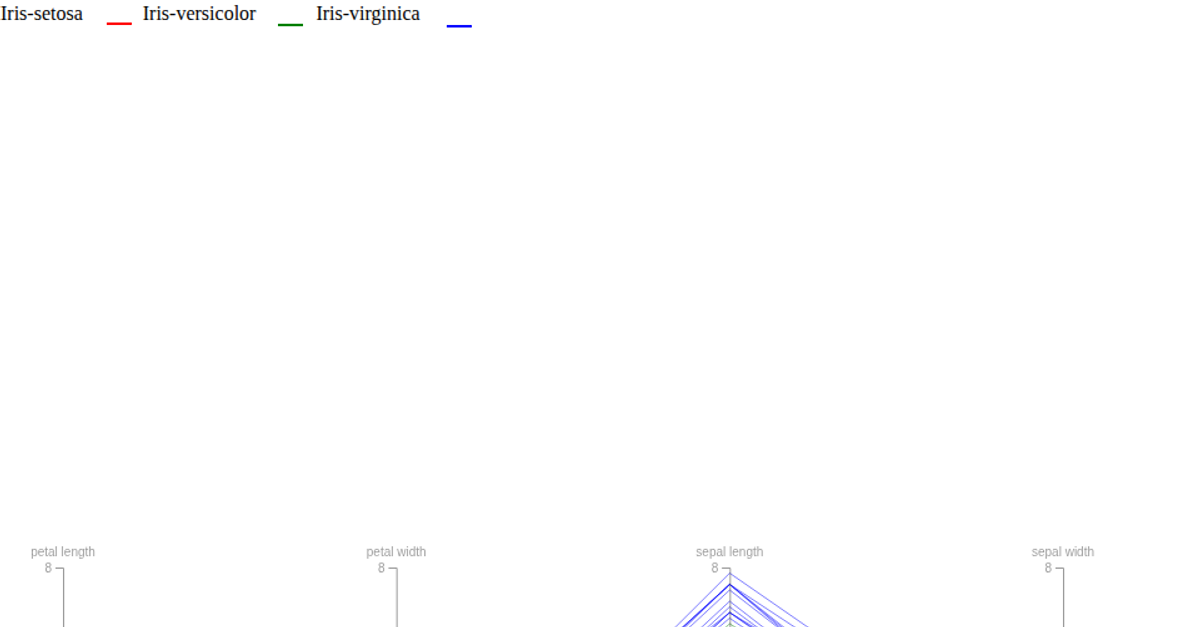
The visualization displays the classic Iris dataset as a parallel coordinates plot, with each axis representing a measured feature (sepal length, sepal width, petal length, petal width) and the categorical species class. Each line tracks an individual flower across the axes, and the CSS classes color-code the three species (Iris-setosa, Iris-versicolor, Iris-virginica). Users can drag the axis labels to reorder dimensions, triggering a redraw via `d3.scalePoint` and `d3.line`. The axes are rendered using `d3.axisLeft` and `d3.axisBottom`, with animated transitions managed through D3's `join` operation on SVG paths.
AI-generated descriptionMIT Licensed



Comments
Sign in to join the discussion.