🌍 Public
Cricket Score Graph
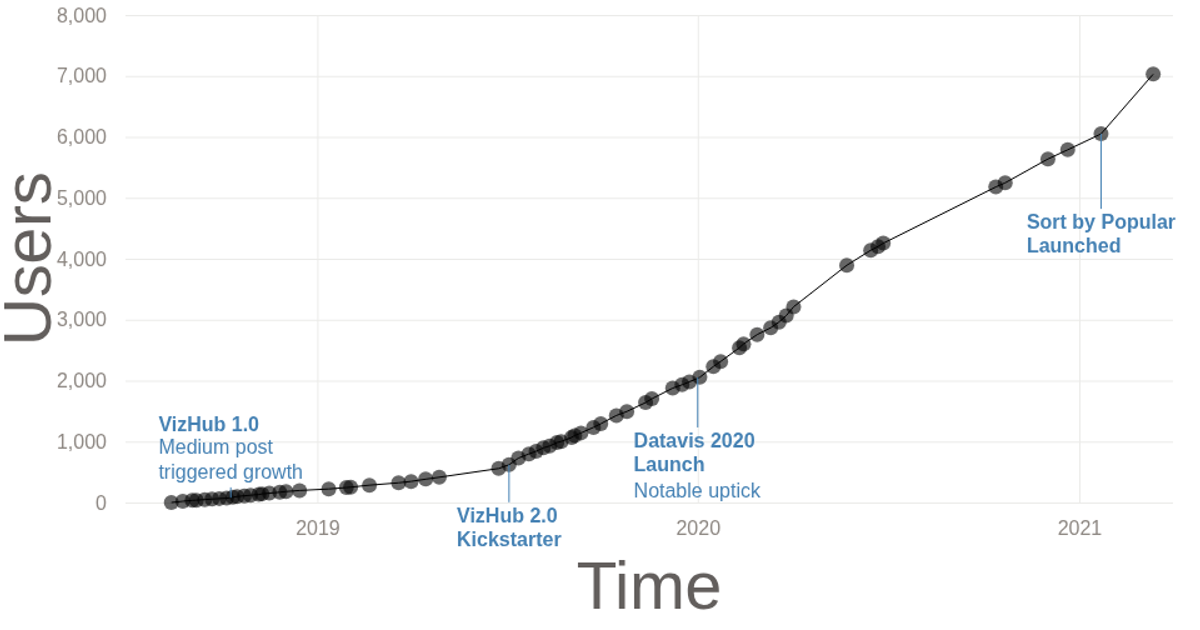
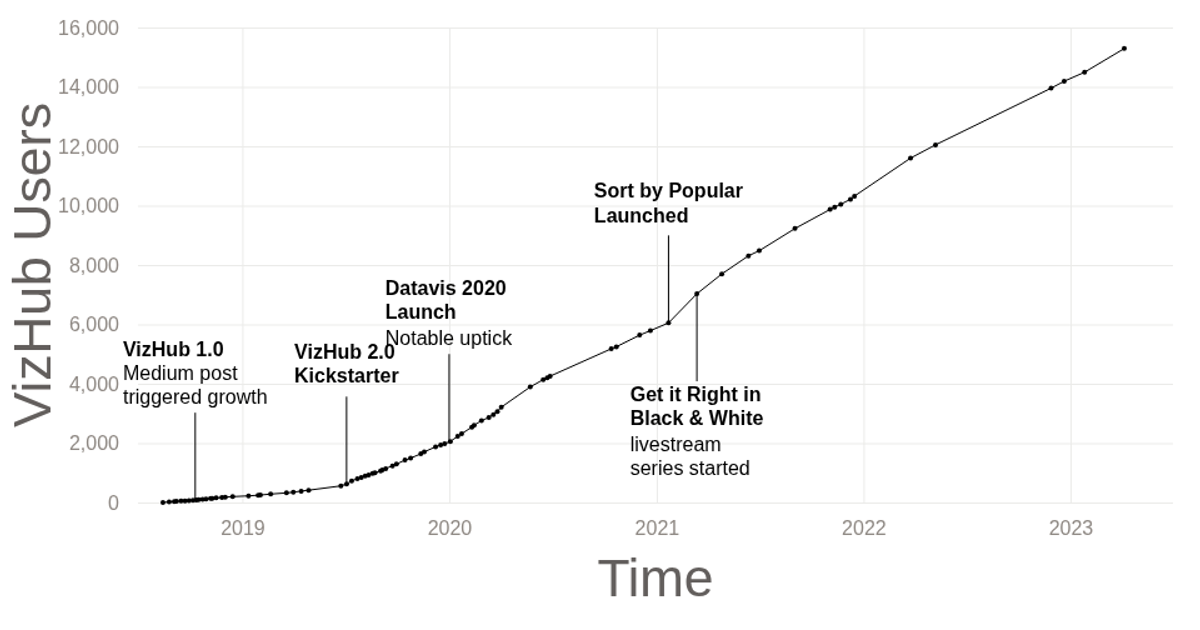
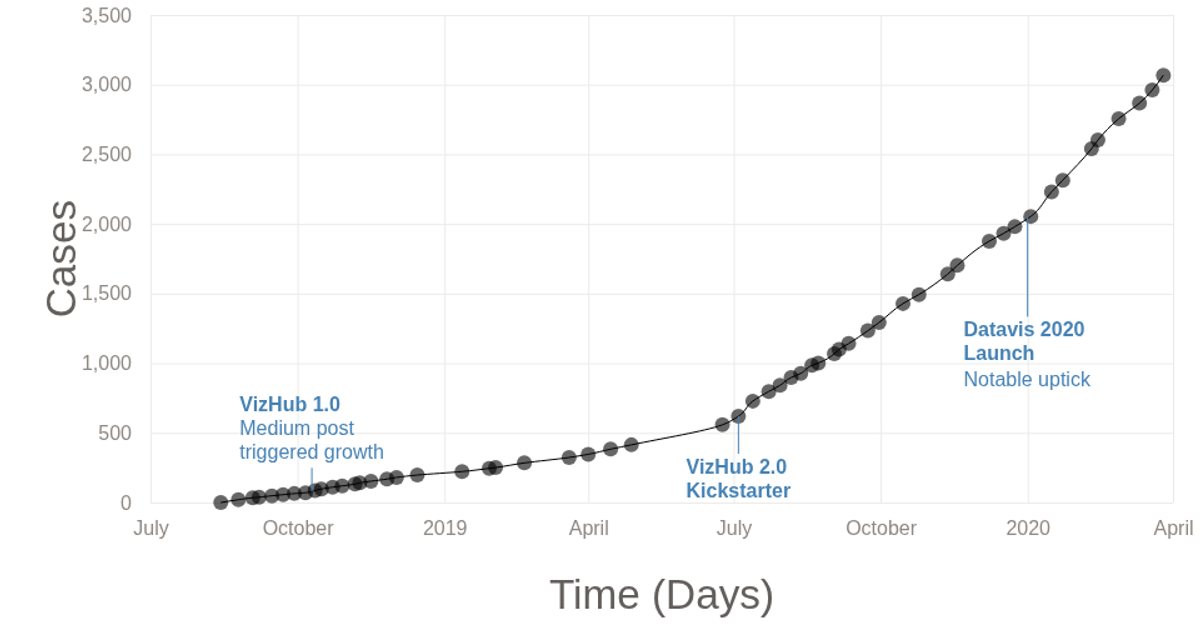
This visualization tracks the growth of VizHub users over time, from its launch in August 2018 through February 2020. A line chart with circular data points shows increasing user counts, with three annotated labels marking significant milestones like the VizHub 1.0 release and the Datavis 2020 launch. The code uses d3.line with a curveMonotoneY curve for the line, d3.scaleTime and d3.scaleLinear for axes, and the d3-svg-annotation library for labels. Data is loaded from a CSV file, and the SVG rendering includes tick marks and gridlines.
AI-generated descriptionThe number of VizHub users over time, since it was launched on August 14, 2018.
MIT Licensed




Comments
Sign in to join the discussion.