🌍 Public
BHAVANI TASK 9
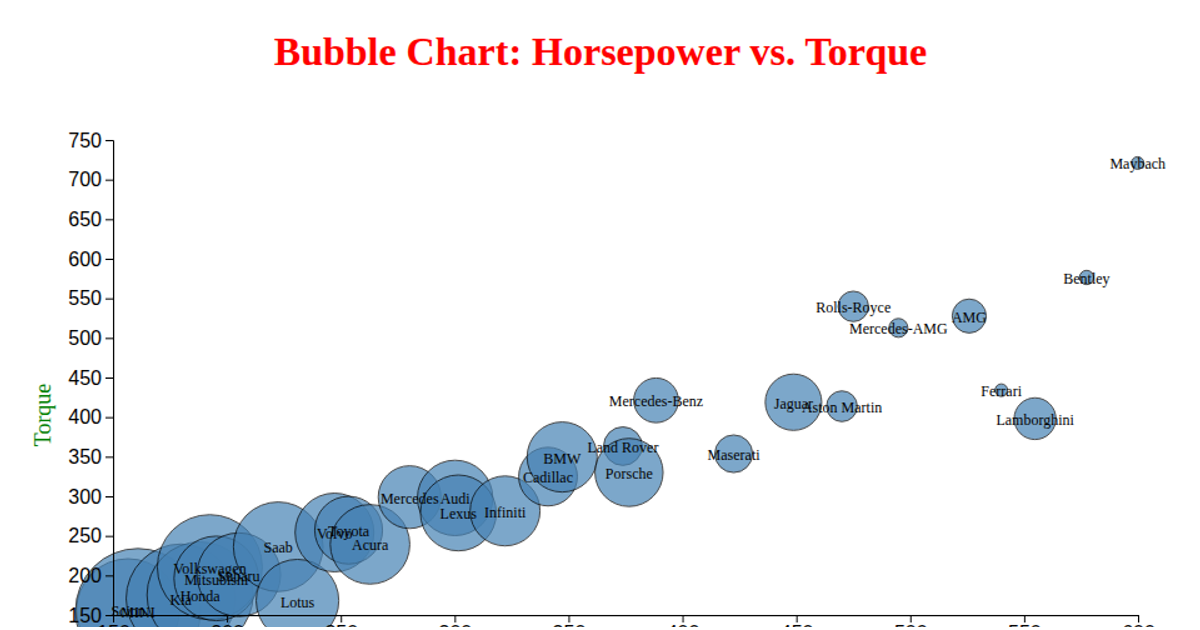
This area chart visualizes the relationship between horsepower and torque for a dataset of vehicles. It uses D3.js v5 to load CSV data and render an SVG visualization, with the area filled in steelblue at 70% opacity. The chart employs `d3.scaleLinear` for both axes, `d3.area` to generate the shaded path, and `d3.axisBottom` and `d3.axisLeft` to display the axes. Axis labels for Torque and Horsepower are appended as SVG text elements, and data comes from a remote GitHub repository.
AI-generated descriptionMIT Licensed



Comments
Sign in to join the discussion.