🌍 Public
Vega-lite-api-part2
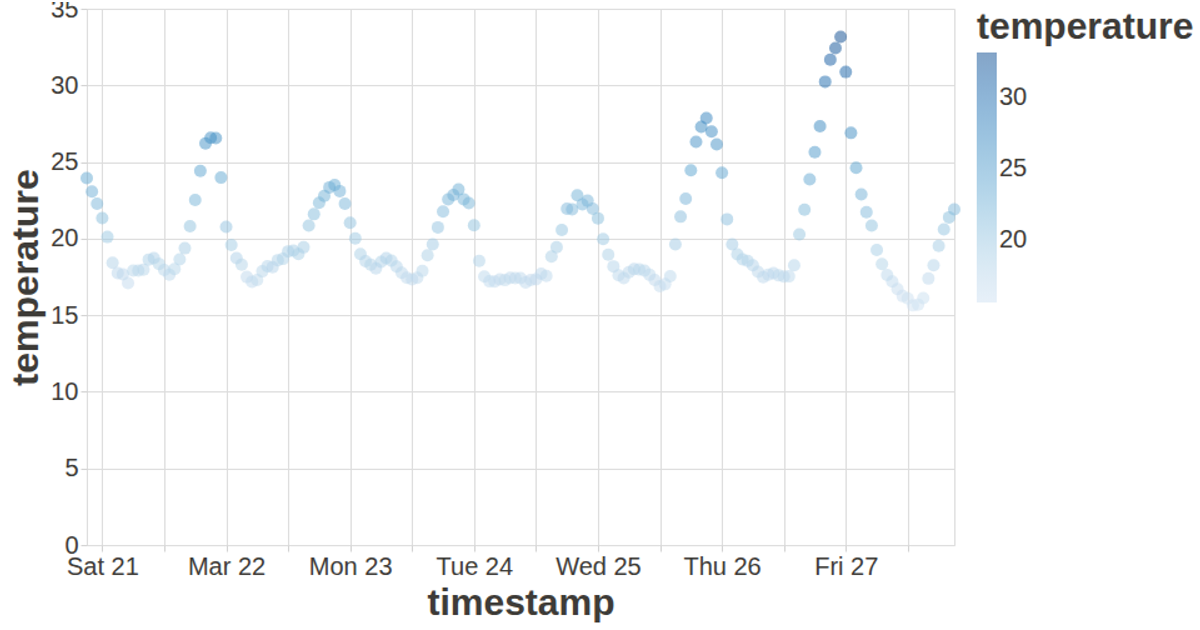
This visualization displays daily atmospheric conditions in Belgium for 2021, using a bar chart to show mean relative humidity per month, with color encoding by wind speed and bars stacked by wind speed category. A second scatter plot shows air temperature averages over time. The code uses Vega-Lite API with React, D3’s CSV loader, Vega tooltip, and custom config for styling.
AI-generated descriptionA bare minimum HTML page demonstrating use of CSS and JavaScript.
See also React Starter.
MIT Licensed




Comments
Sign in to join the discussion.