🌍 Public
Pie Chart latha bemanadham 11714828
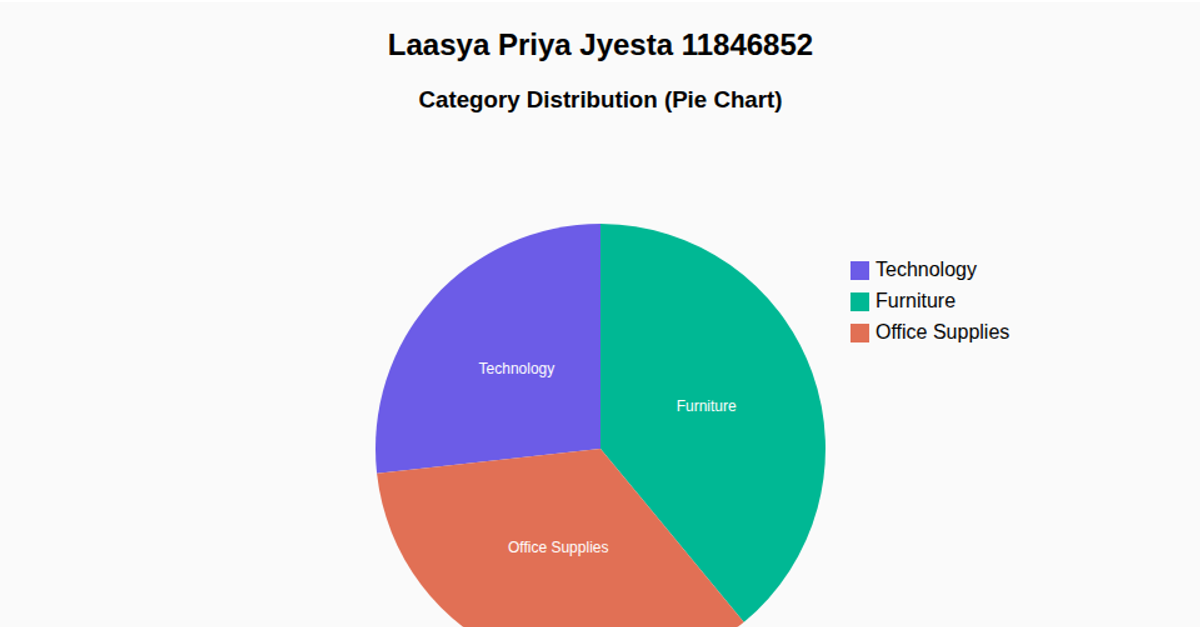
This pie chart visualizes the distribution of cosmetic product types from a CSV dataset, showing the frequency of each category with labeled slices and a color-coded legend. It uses D3 v6 APIs including `d3.pie`, `d3.arc`, `d3.rollup`, and `d3.scaleOrdinal` with `d3.schemeCategory10` to generate and style the SVG chart, placing a red title above the visualization.
AI-generated descriptionMIT Licensed


Comments
Sign in to join the discussion.