🌍 Public
Porpulation report
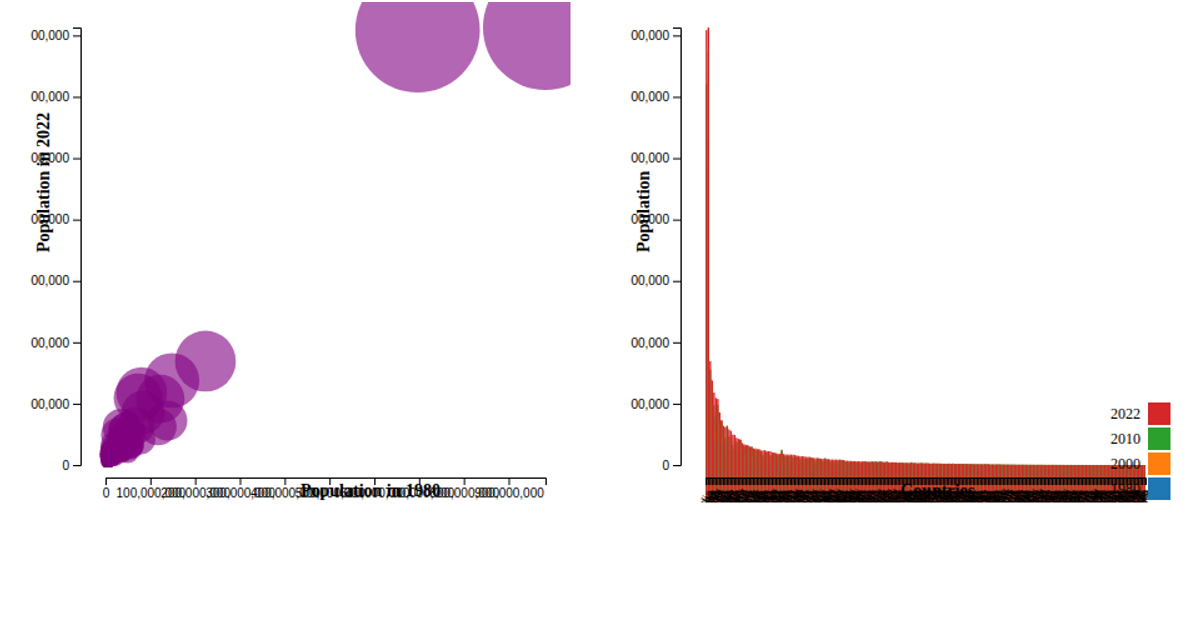
This visualization displays population data for multiple countries and regions from 1960 to 2020. The SVG chart renders a red background, though the visualization logic is incomplete. The code imports D3 v7 via CDN and references a population dataset stored as a JSON array object in a separate JavaScript file. It uses D3's selection API to target the SVG element and apply styling, while the bundled JavaScript file handles the main data processing and rendering.
AI-generated descriptionA demonstration of how to start using D3 version 6.
MIT Licensed


Comments
Sign in to join the discussion.