🌍 Public
Contour
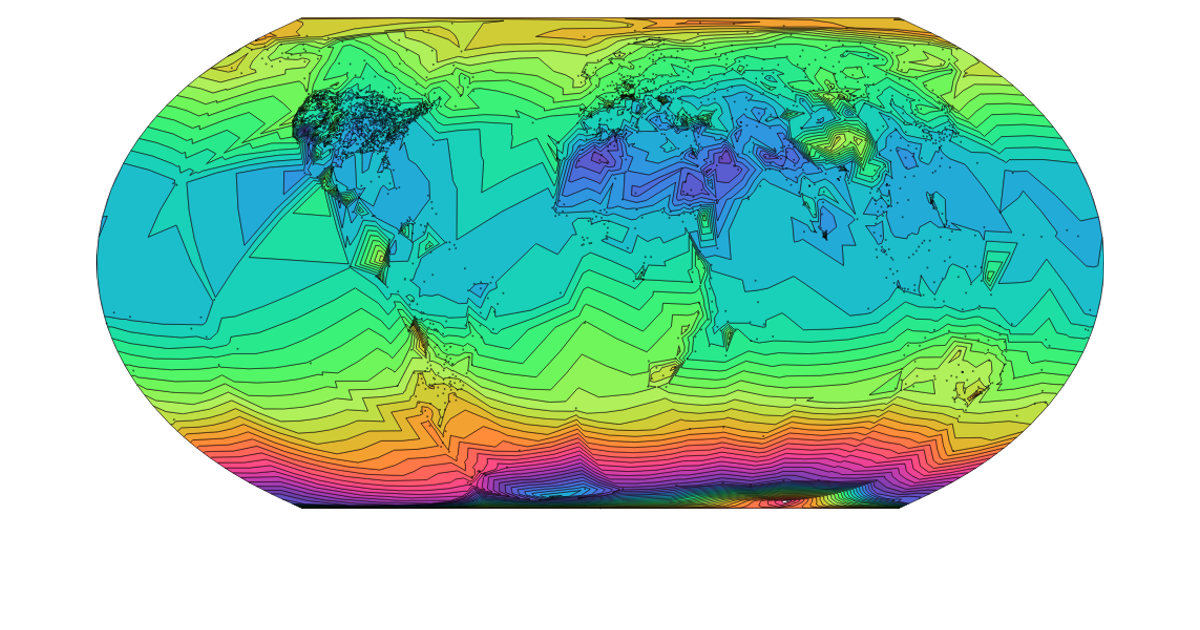
A contour map visualizes temperature change across U.S. climate divisions, with colored contour bands overlaid on state boundaries. The visualization uses d3.geoVoronoi to assign grid points to climate divisions, d3.contourDensity to generate contours from weighted point data, and d3.geoPath with an AlbersUSA projection to render geographic features. Temperature values from a CSV file drive contour density, while a diverging color scale maps contour thresholds.
AI-generated descriptionA bare minimum HTML page demonstrating use of CSS and JavaScript.
See also React Starter.
MIT Licensed


Comments
Sign in to join the discussion.