🌍 Public
Data point's op de kaart met enquete data
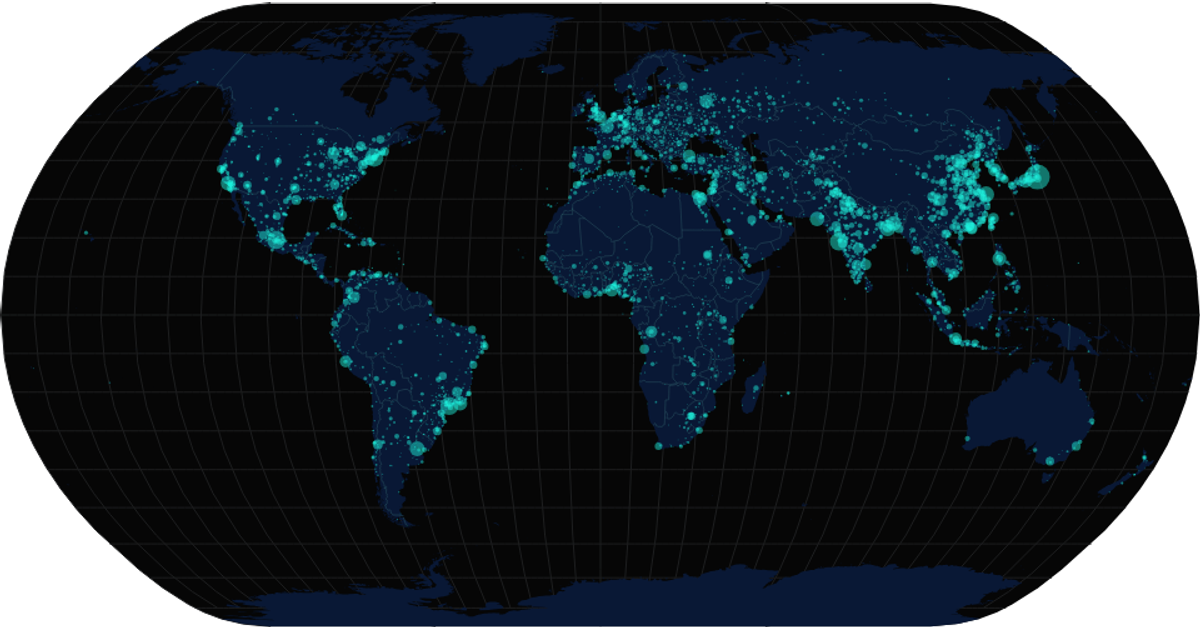
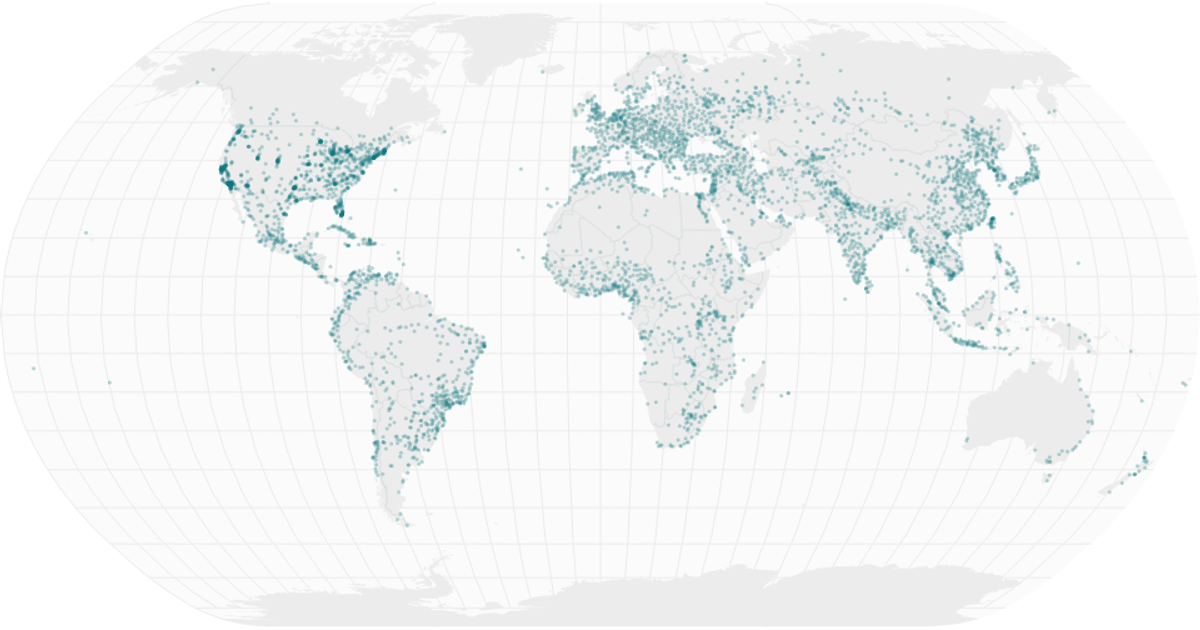
A world map displays survey responses as individual data points, each marking a GPS coordinate where a respondent found a place beautiful. The map uses a Mercator projection with `d3.geoPath` to render country boundaries from TopoJSON, while coordinate cleaning and DMS conversion happen in a separate module. Points are drawn as SVG circles using `d3.geoMercator`. The visualization supports pan and zoom through d3’s `zoom` behavior, applied to the map group.
AI-generated descriptionMIT Licensed





Comments
Sign in to join the discussion.