🌍 Public
Fork of Q1.1
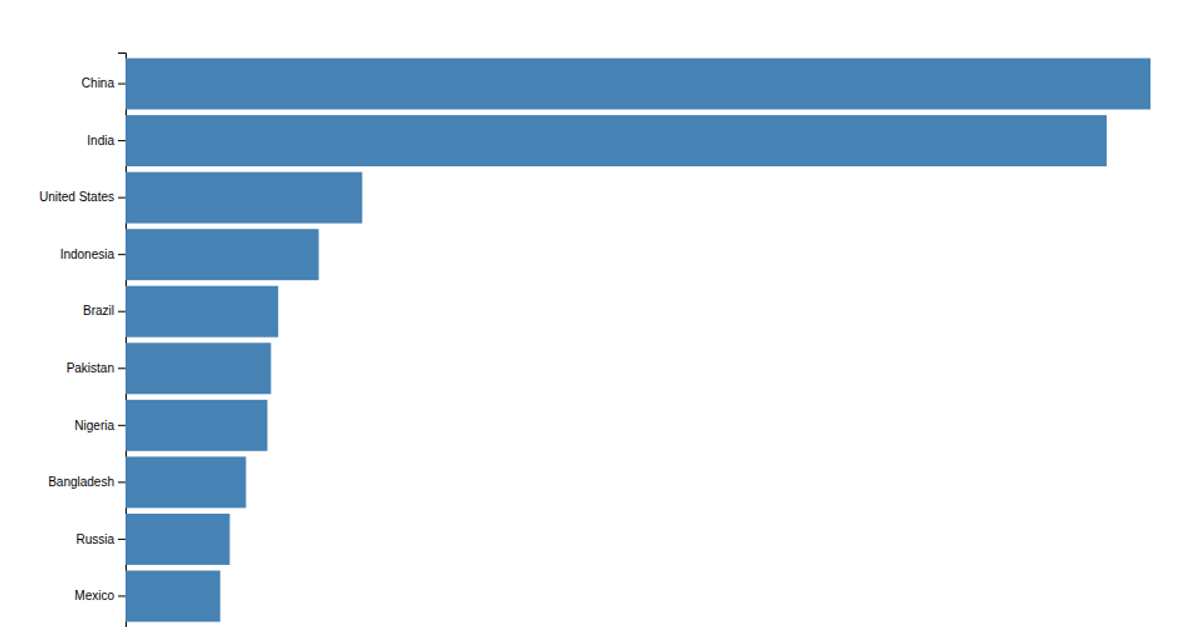
A horizontal bar chart shows the population of ten countries in the year 2000, using static SVG rectangles colored in steel blue. The visualization ranks countries by population value, with China and India leading the dataset. It uses d3.scaleLinear for the x-axis, d3.scaleBand for the y-axis categories, and d3.axisBottom and d3.axisLeft to render the axes. The chart displays hardcoded population data and includes a title and x-axis label, with styling applied via external CSS.
AI-generated descriptionMIT Licensed




Comments
Sign in to join the discussion.