🌍 Public
Activity_8 Task_4
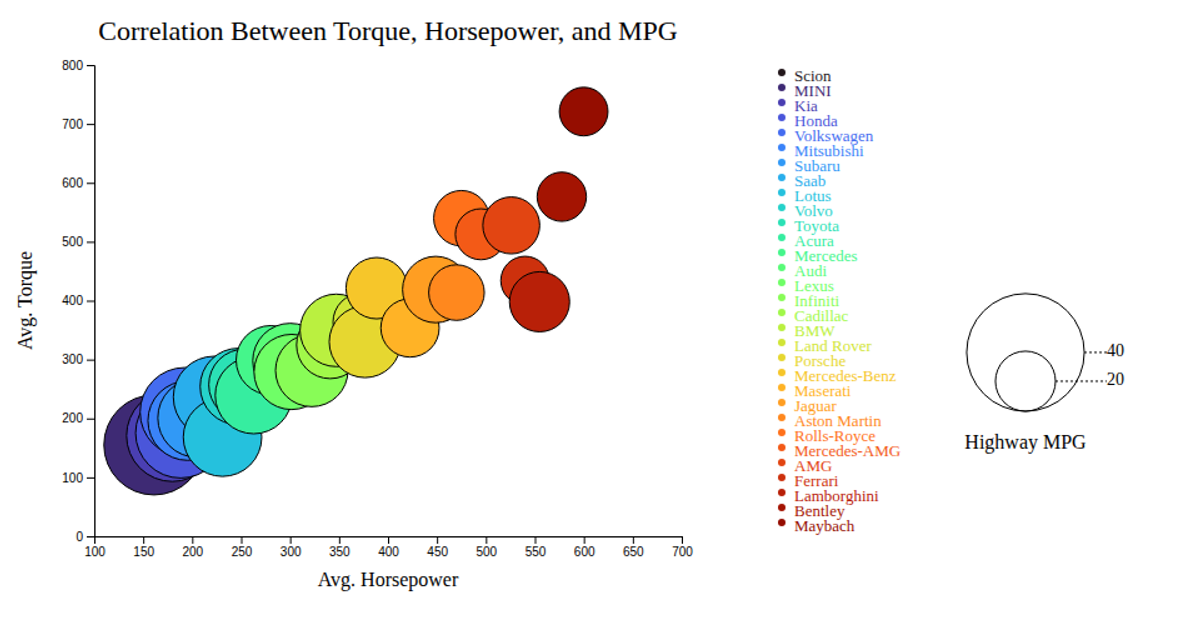
A bubble chart visualizes the correlation between average horsepower (x-axis), average torque (y-axis), and highway MPG (bubble size) for various car makes, with each bubble colored by make. The SVG is rendered using d3.v7, with d3.scaleLinear for axes and bubble radius, and d3.scaleOrdinal for color mapping. Interactive tooltips appear on mouseover, showing the car make. Data comes from bubblechart.csv, aggregated per make.
AI-generated descriptionMIT Licensed




Comments
Sign in to join the discussion.