🌍 Public
Fork of Pooja's Line Chart
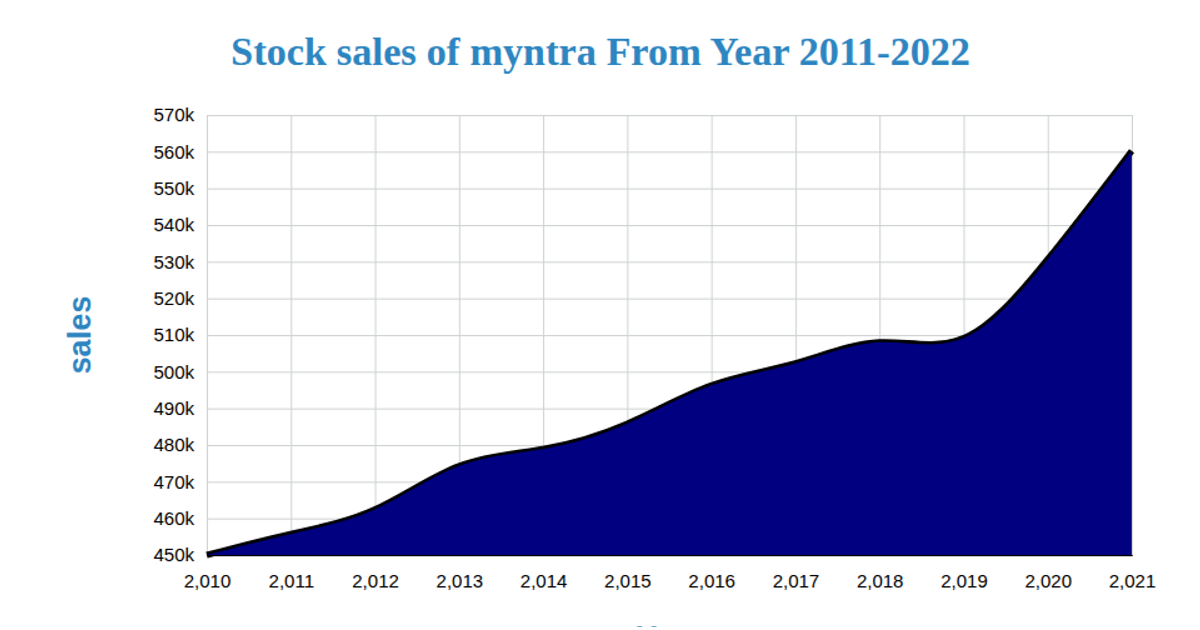
This fork of Pooja's line chart visualizes Myntra's stock sales from 2011 to 2022, showing a temporal trend of sales figures over the years. The SVG chart uses d3.scaleTime and d3.scaleLinear for the axes, while d3.line generates the path connecting data points. d3.csv loads the dataset from a GitHub gist, with year values parsed as Date objects and sales as numbers. The visualization includes axis labels, a title, and styling through an external CSS file.
AI-generated descriptionMIT Licensed



Comments
Sign in to join the discussion.