🌍 Public
Pie Chart
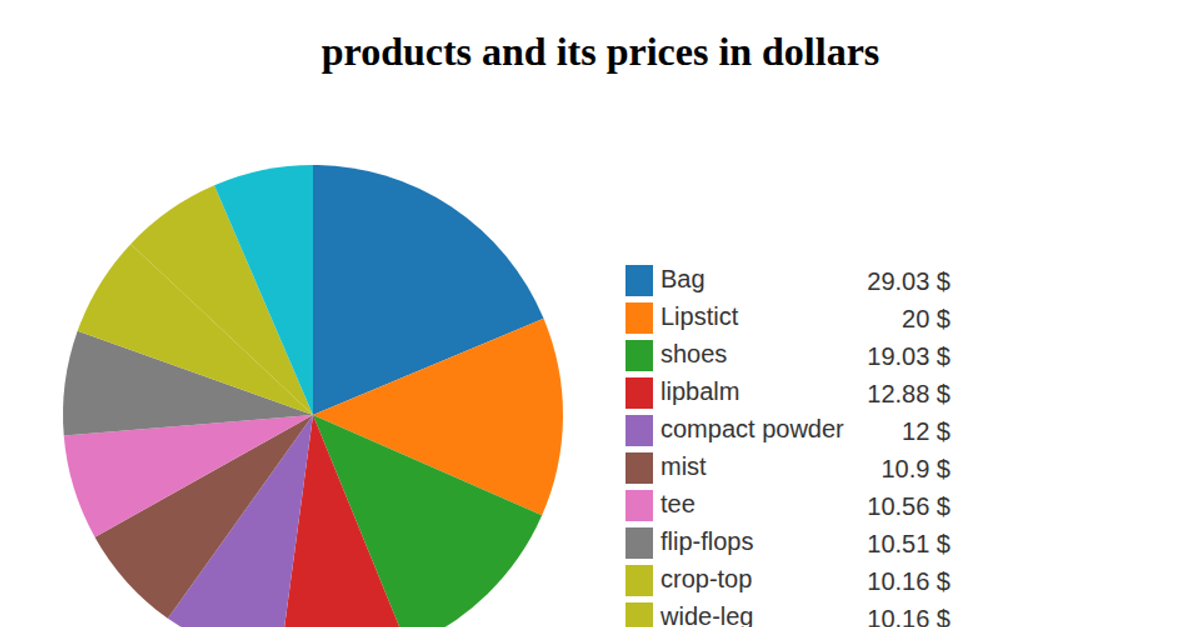
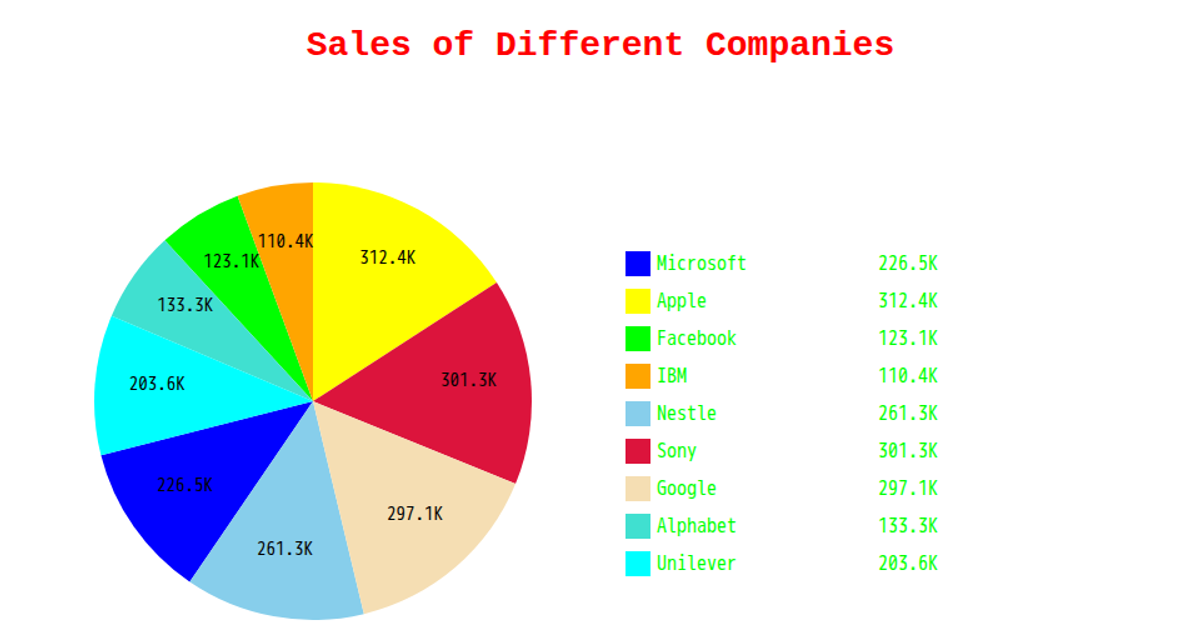
This pie chart visualizes the largest internet companies by revenue in US dollars. Sectors are rendered as SVG paths using the `arc` generator, with colors assigned by `scaleOrdinal` and `schemeCategory10`. A legend lists each company with its corresponding color and revenue value. The chart displays the top 10 entries, sorted by revenue, sourced from a CSV file via `csv()` and loaded through the D3 library.
AI-generated descriptionA bare minimum HTML page demonstrating use of CSS and JavaScript.
See also React Starter.
MIT Licensed




Comments
Sign in to join the discussion.