🌍 Public
Fork of Fork of Fork of D3 Starter
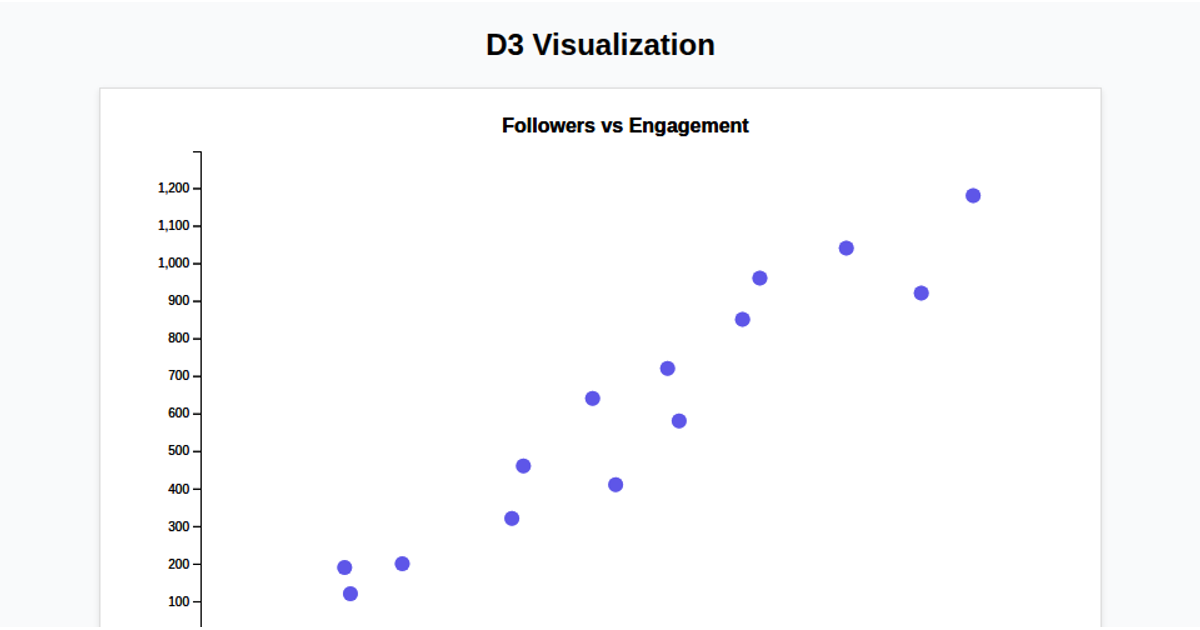
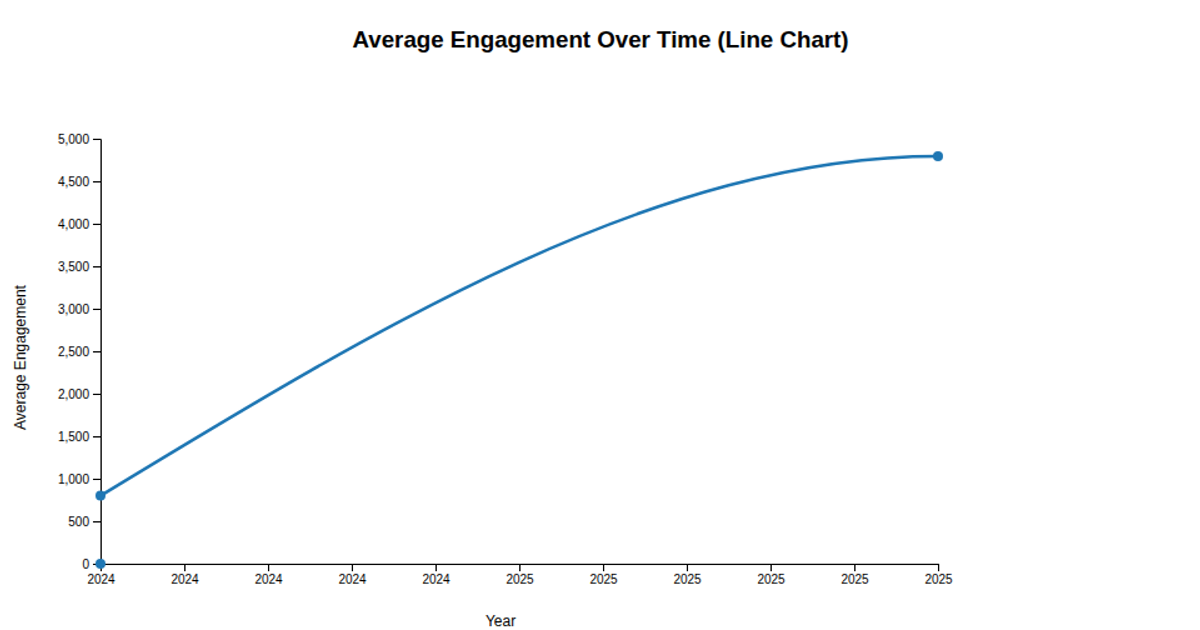
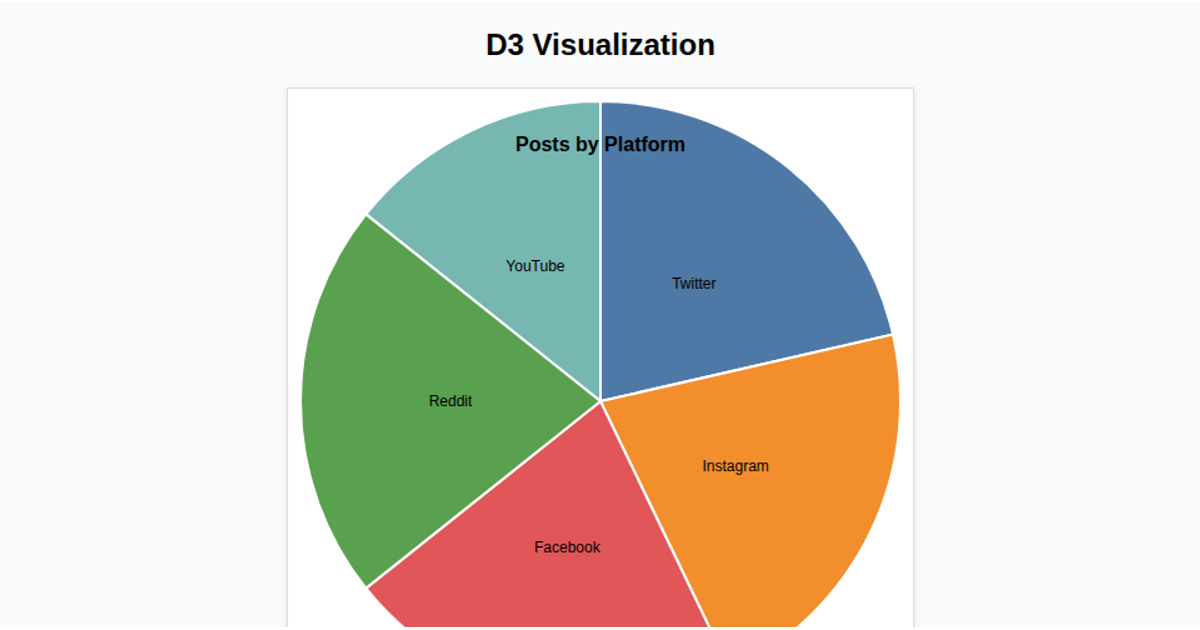
This example visualizes the average engagement of social media posts per year, drawing on a CSV dataset that includes author, follower count, engagement, platform, and post date. A monotone X-curved line chart displays the trend, with the y-axis scaled to a maximum value 10% above the data’s peak. Built with D3 v7, the code uses `d3.csv`, `d3.rollup`, `d3.scaleLinear`, `d3.line`, and `d3.axisBottom`/`d3.axisLeft`, rendering to an SVG with styled margins and a red stroke line.
AI-generated descriptionMIT Licensed




Comments
Sign in to join the discussion.