🌍 Public
NSYSU HW1
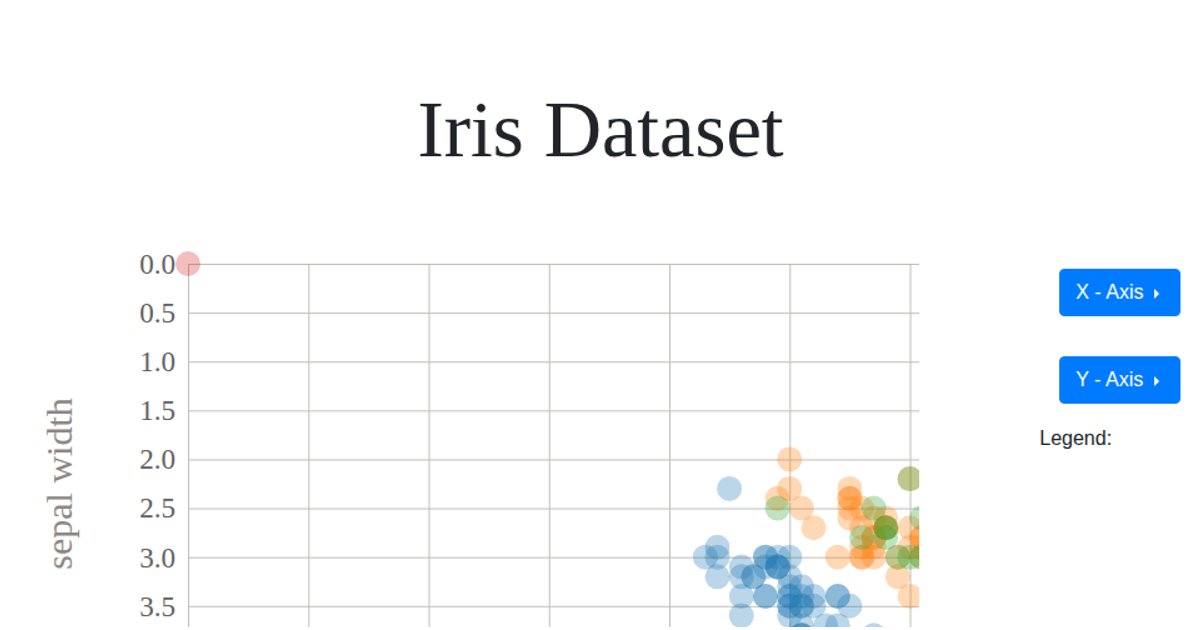
This interactive scatter plot displays the Iris flower dataset, allowing users to explore relationships between sepal and petal measurements across three species, each color-coded (red, green, blue). Radio buttons control the X and Y axes independently. The visualization uses D3 v4 with SVG rendering, drawing circles at fixed radius. Axis scales are computed dynamically via `d3.scaleLinear`, with tick marks generated through `d3.axisBottom` and `d3.axisLeft`. Data is loaded asynchronously from a CSV file using `d3.csv`, and the plot redraws entirely on any axis change.
AI-generated descriptionMIT Licensed




Comments
Sign in to join the discussion.