🌍 Public
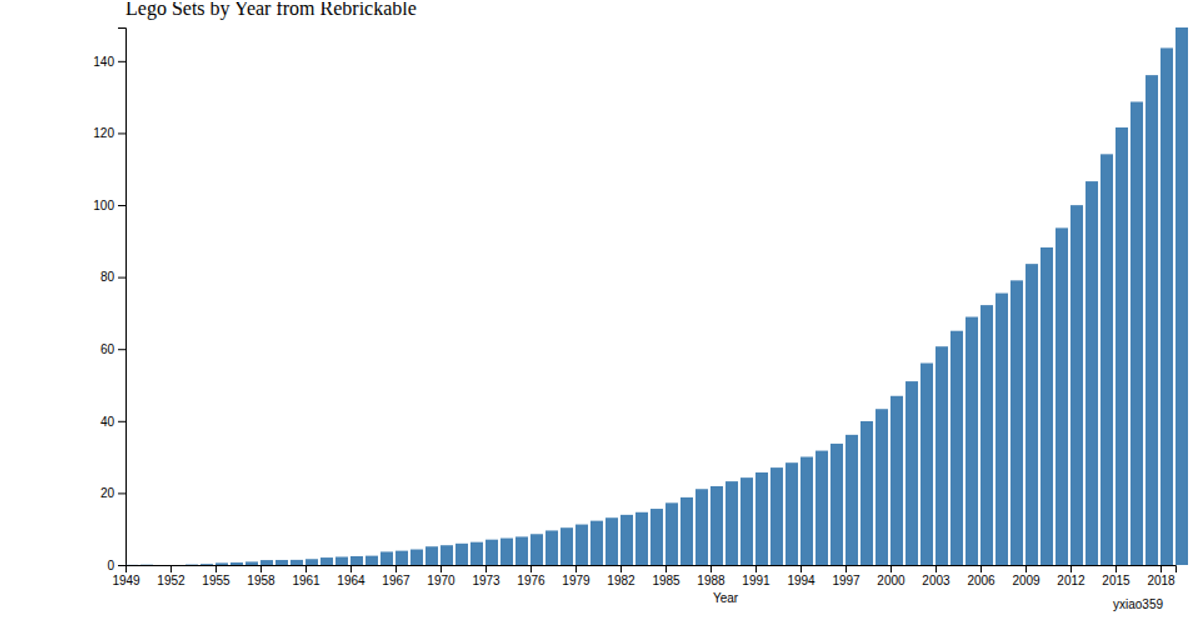
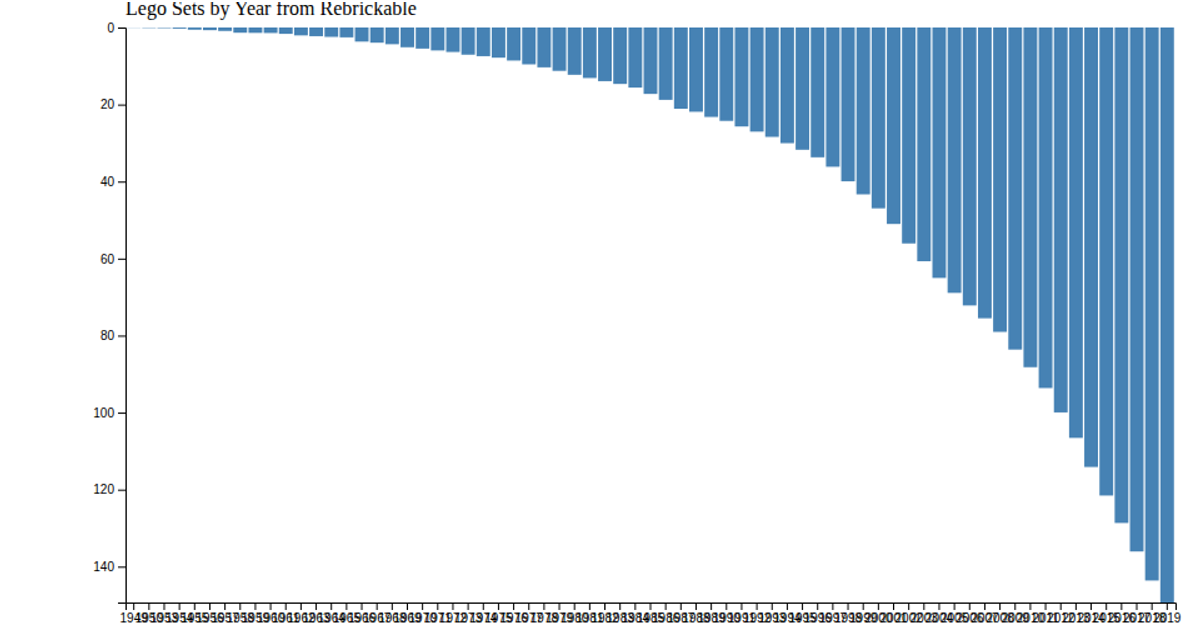
Lego Sets by Year from Rebrickable
This visualization displays the cumulative number of Lego sets released each year, using data from Rebrickable. It shows a running total over time with a bar chart rendered as SVG. The code imports specific D3 v5 modules, including `scaleLinear`, `scaleTime`, `csv`, `axisLeft`, and `axisBottom`, to construct the axes and plot. The x-axis is formatted with time intervals, while the y-axis is scaled linearly. The visualization reads the dataset from a CSV file, calculates the maximum value for domain scaling, and appends rectangles to represent the data.
AI-generated descriptionAn example showing the capabilities of VizHub.
MIT Licensed





Comments
Sign in to join the discussion.