🌍 Public
Missing Migrants on a Map
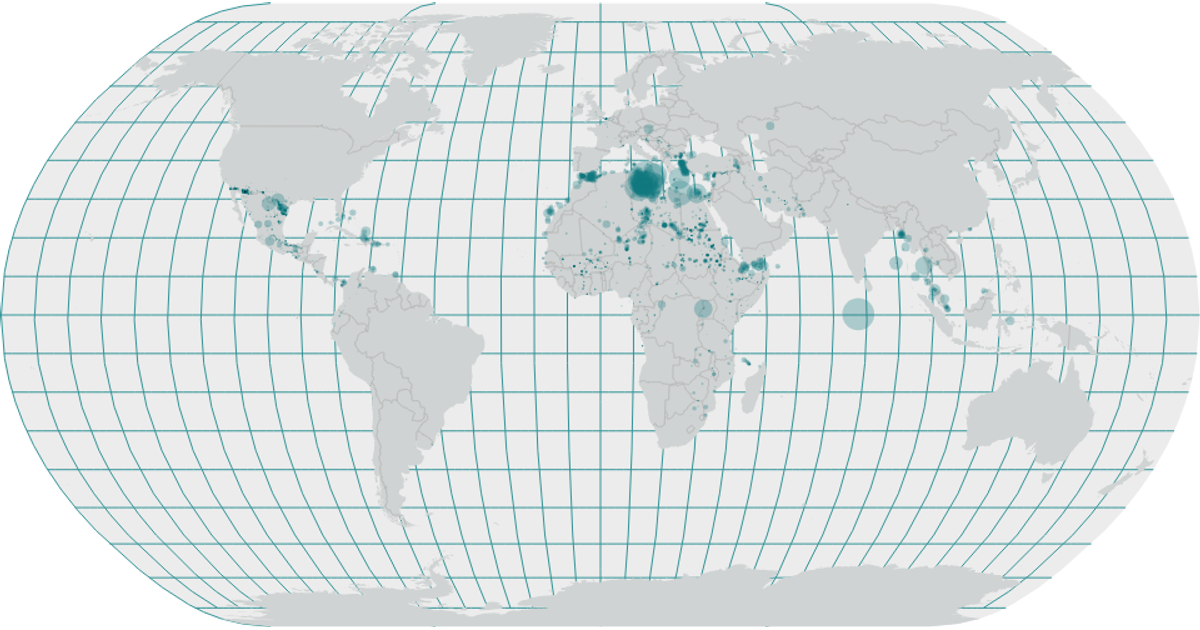
A natural earth projection displays global migration routes, with circles sized by the square root of total dead and missing migrants from the Missing Migrants Global 2019 subset. The map shows land in gray, graticules, and ocean-colored points. Built with React and D3 v5, it uses `geoNaturalEarth1`, `geoPath`, and `geoGraticule` for the map, while `scaleSqrt` maps fatality counts to circle radii. Data is loaded via `csv` from a remote GitHub-hosted dataset.
AI-generated descriptionA scatter plot of Data Canvas Sense Your City Dataset.
MIT Licensed


Comments
Sign in to join the discussion.