🌍 Public
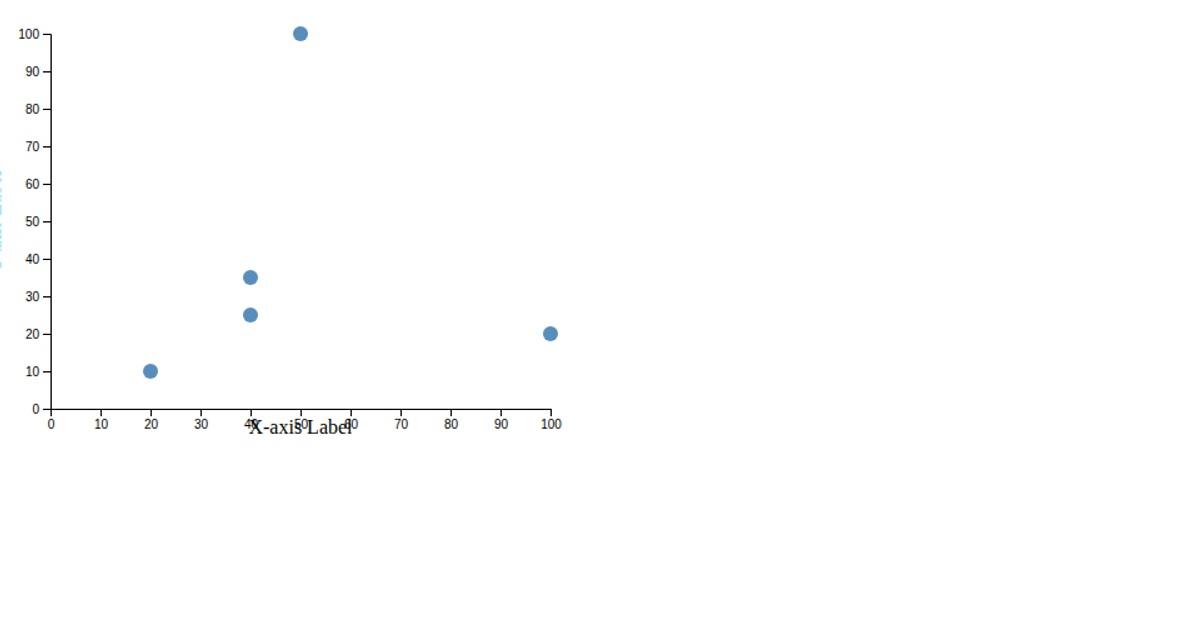
Making a scatter plot
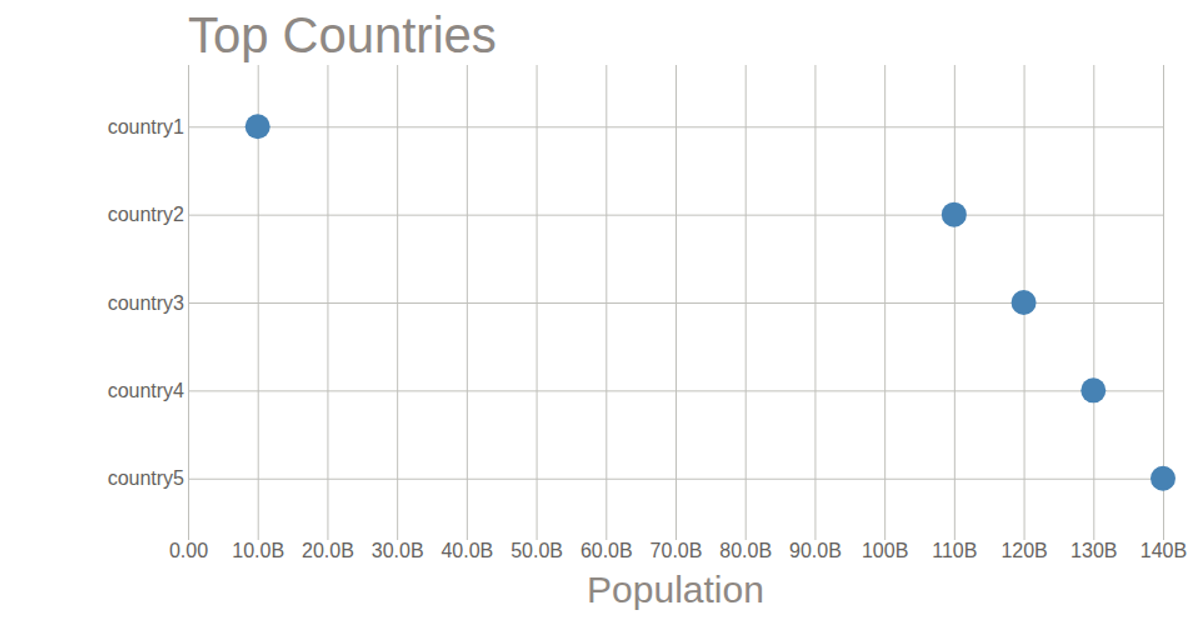
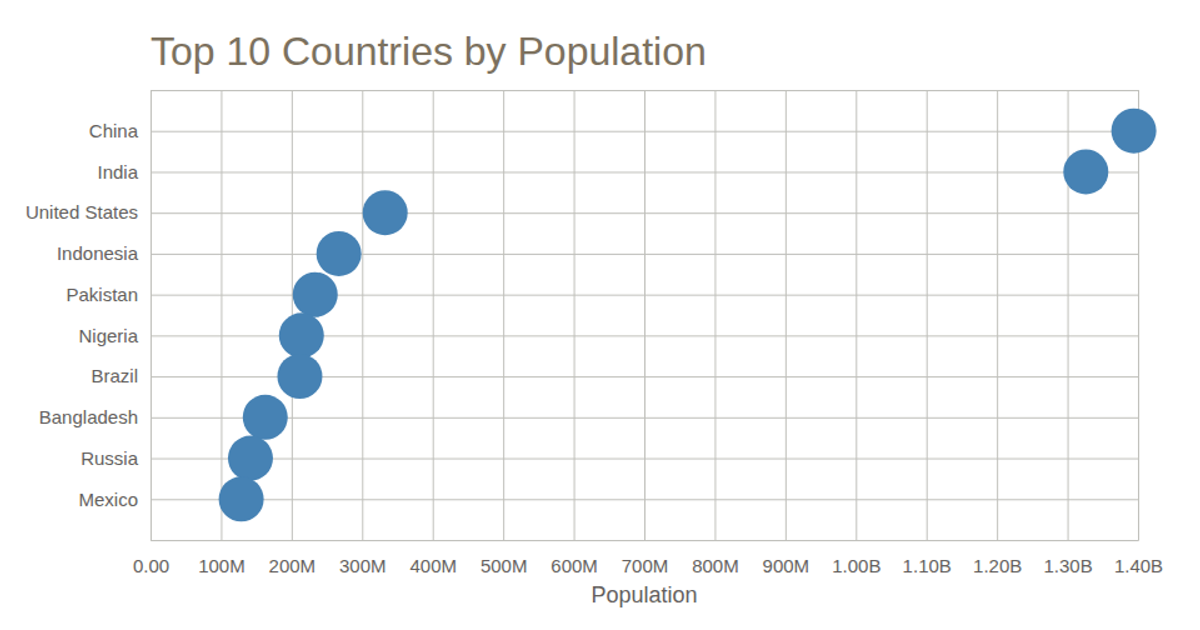
This example demonstrates how to create a scatter plot using D3.js version 5, loaded via UNPKG, and rendered as an SVG. It imports functions like `csv`, `scaleLinear`, `scaleBand`, and `max` from the D3 library to process and visualize the `data.csv` file containing country populations. The code uses `svg.append` to dynamically add rectangles to the chart, with axes scaled using `scaleLinear` and `scaleBand`. It also includes a local ES6 module, `myMessage.js`, which displays a simple greeting message.
AI-generated descriptionAn example showing the capabilities of VizHub:
- Loads D3 via UNPKG.
- Demonstrates use of
importfrom"d3". - Demonstrates use of
importfrom local ES6 modules.
MIT Licensed





Comments
Sign in to join the discussion.