🌍 Public
Transforming Data
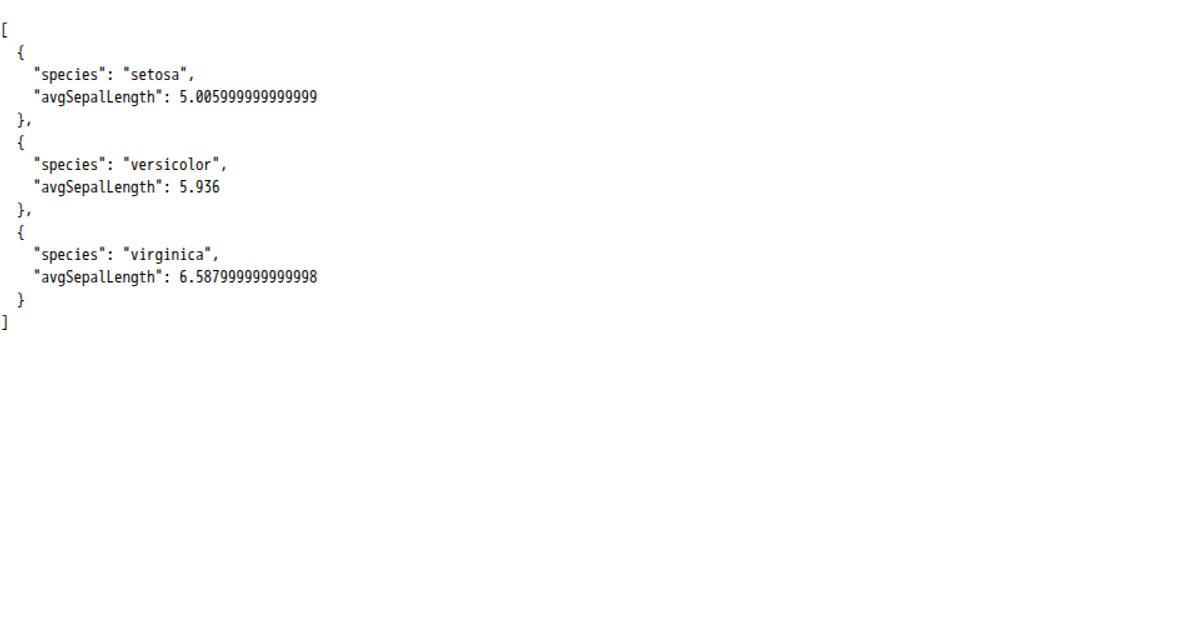
This example transforms a CSV file of S&P 500 stock data for 2022 into a summary of stock counts per industry. It demonstrates data-processing pipelines from the D3 library, including `flatGroup` to aggregate records by industry, `csvParse` to load the data, and `select` to render the resulting count as formatted JSON text. The visualization initially fetches the data from a remote gist URL, parses numeric fields, and then updates its display using a state-based rendering loop.
AI-generated descriptionCount of Stock data for each of the Industry
MIT Licensed




Comments
Sign in to join the discussion.