🌍 Public
White Hat Bar Chart
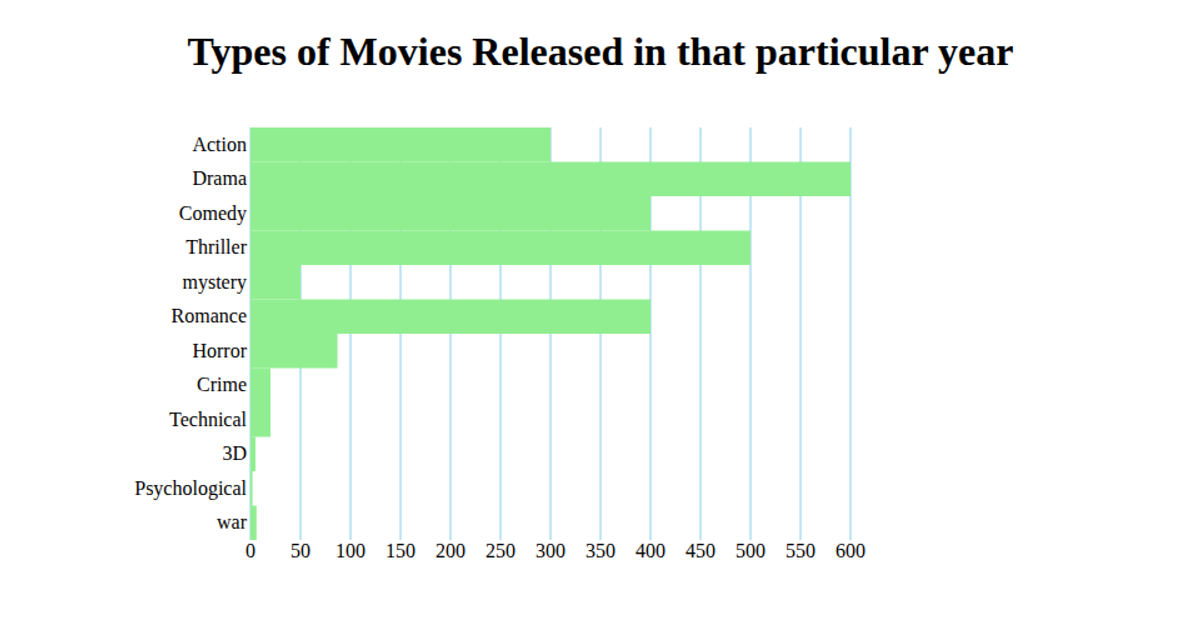
This bar chart displays the percentage of viewers for different movie categories, with each bar labeled with its exact value. The visualization uses D3 v6 to load CSV data, apply a band scale for the x-axis, and a linear scale for the y-axis. Rectangles are rendered in SVG with a light blue fill, while axis labels and data values are added as text elements. The chart is titled "Movie Categories and Viewership" and includes a rotated y-axis label indicating "% of Viewers."
AI-generated descriptionA bare minimum HTML page demonstrating use of CSS and JavaScript.
See also React Starter.
MIT Licensed





Comments
Sign in to join the discussion.