🌍 Public
D3js gab
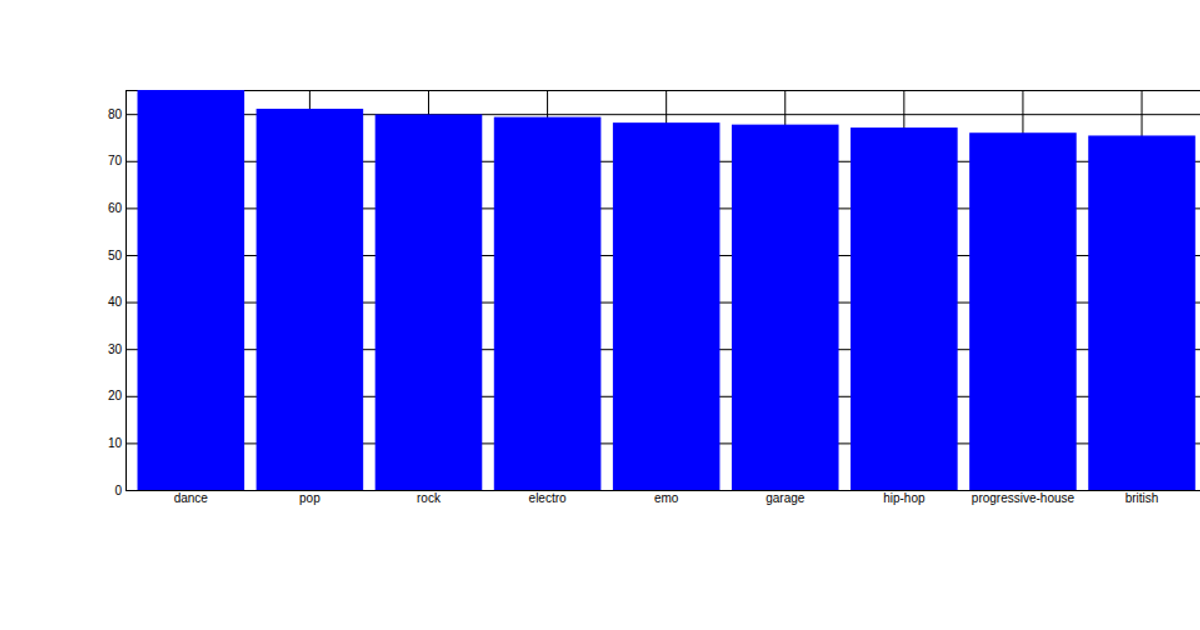
This bar chart displays the popularity of 50 music genres, ranked by a sum of artist popularity. The visualization uses a standard vertical bar layout with an x-axis for genre names and a y-axis for the popularity sum. Built with D3.js v3, the code uses `d3.select`, `d3.json`, `d3.scale.ordinal`, `d3.scale.linear`, and `d3.svg.axis` to fetch data from a remote API, create the scales, and render the SVG bars. The chart includes rotated axis labels and a grid.
AI-generated descriptionA demonstration of how to start using D3 version 6.
MIT Licensed



Comments
Sign in to join the discussion.