🌍 Public
PIB municipios do Brasil
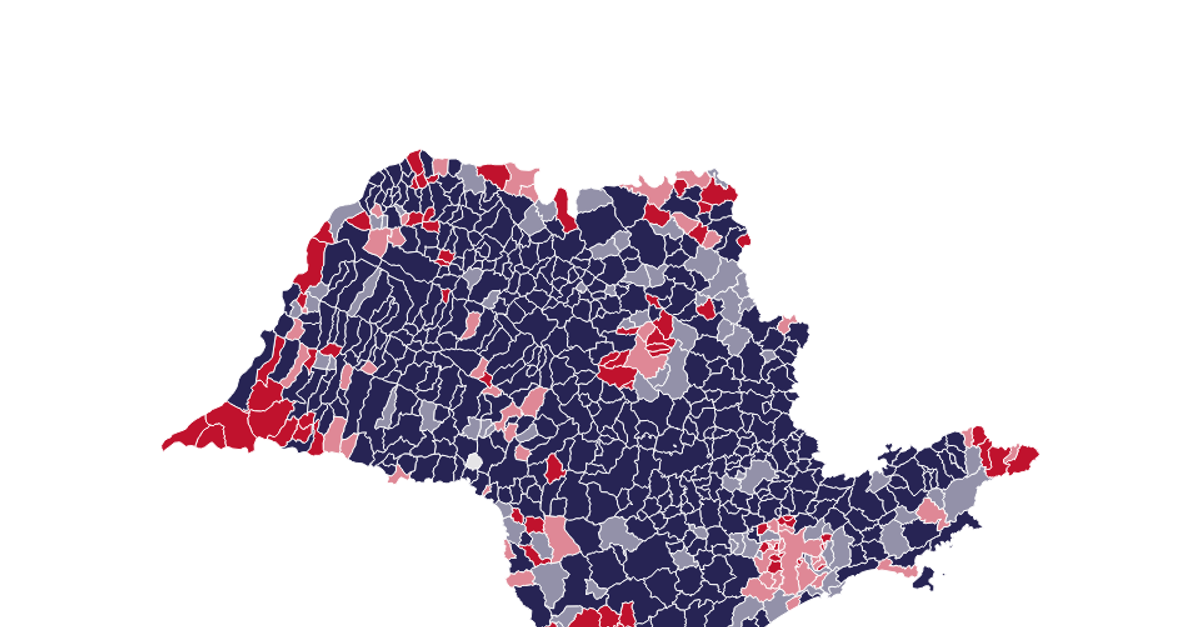
This map shows the gross domestic product (GDP) per capita for municipalities in Rio de Janeiro, Brazil, using a green sequential color scale. Users can click on legend ranges to filter the map and a linked scatter plot, which plots GDP per capita against estimated population. The visualization uses D3 v5 with `d3.geoMercator` and `d3.geoPath` for map projections, `d3.scaleSequential` for coloring, and a custom `colorLegend` component. The data is loaded from external files and rendered as SVG.
AI-generated descriptionA map with the pib per capth for RJ cities. Still missing legends.
MIT Licensed





Comments
Sign in to join the discussion.