🌍 Public
Multiple Views Cleanup
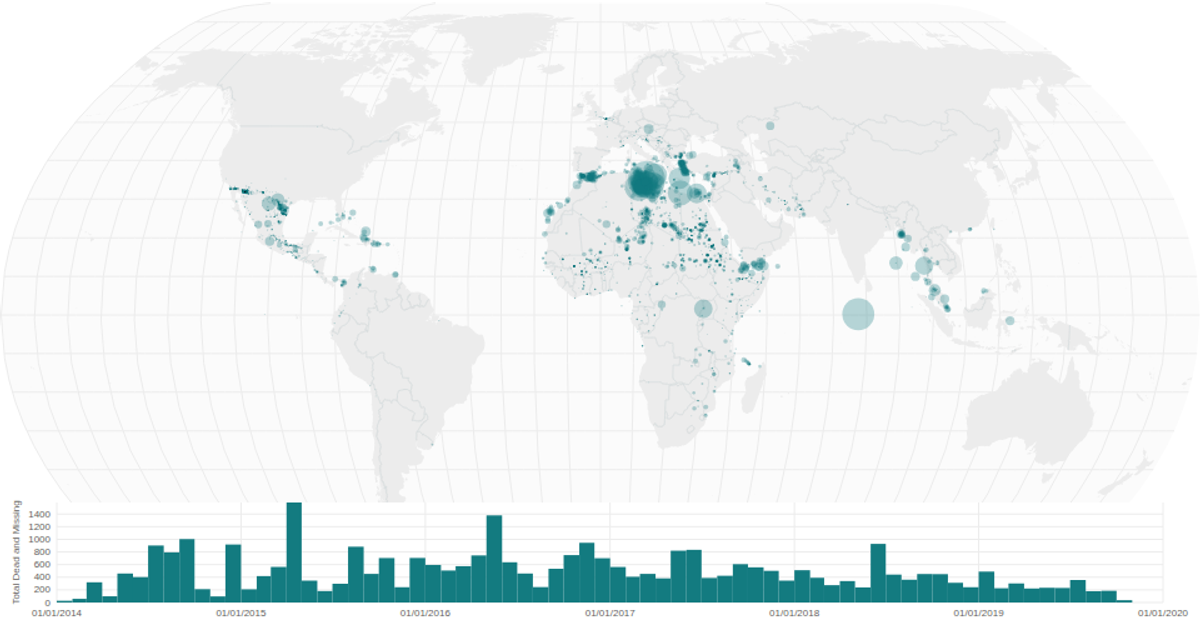
A choropleth-style bubble map of missing migrant incidents overlays a natural Earth projection with graticules and country borders, sized by total dead and missing. A linked time-series histogram below uses a brush to filter the map’s circles. Built with React and D3 v5, it employs `geoNaturalEarth1`, `geoPath`, `scaleSqrt`, `bin`, `brushX`, and `timeMonths` on SVG, drawing from the Missing Migrants Project dataset.
AI-generated descriptionA world map showing cities with population greater than 50,000. City data from Simplemaps: World Cities Database.
Country boundaries from World Atlas TopoJSON, polished for visual style, including graticules.
MIT Licensed



Comments
Sign in to join the discussion.