🌍 Public
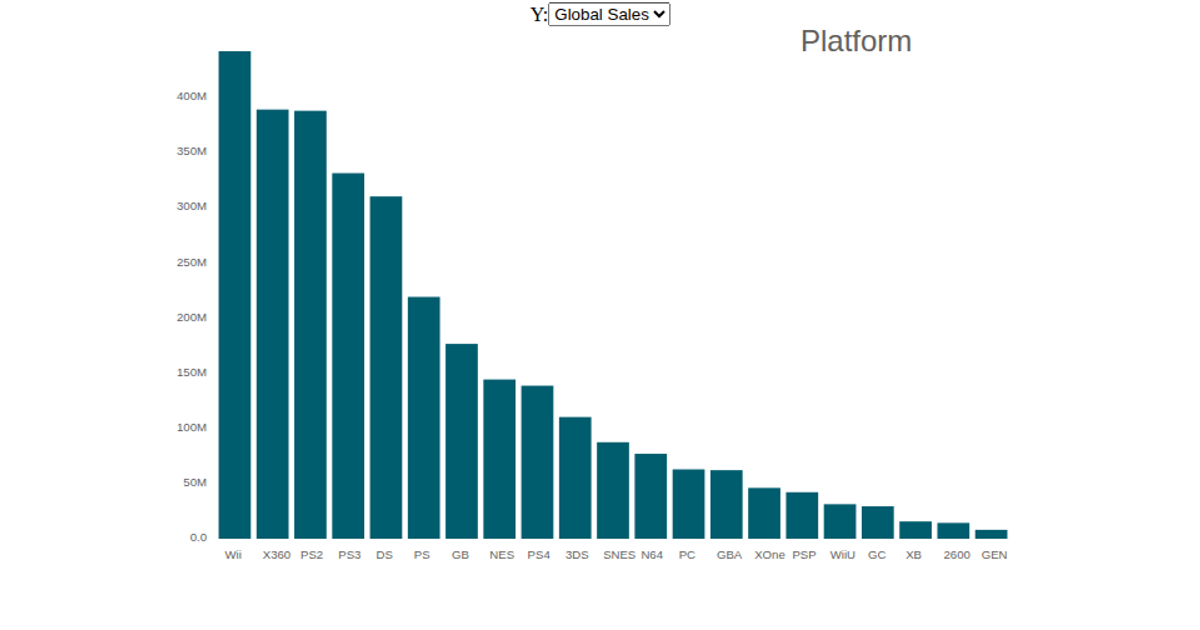
The number of video game sales bar plot
RRochelle
Last edited Oct 7, 2021
Created on Oct 7, 2021
Forked from The ratio of students in the country bar plot
A bar plot shows global video game sales for hundreds of game-platform combinations from a Kaggle dataset, loaded via a gist CSV URL. The example uses D3 v7's `scaleBand` for the categorical x-axis, `scaleLinear` for the numeric y-axis, and renders steel-blue rectangles with `svg` and `selectAll('barplot')` integration. Axis labels are rotated 45 degrees via `attr('transform', 'translate(-10,0)rotate(-45)')`. The chart’s height is fixed at 500 pixels, with margins adjusting the plot area.
AI-generated descriptionA demonstration of how to start using D3 version 6.
The original data is shown in https://www.kaggle.com/gregorut/videogamesales
The dataset is https://gist.githubusercontent.com/Rochelle-Wu/6cb1e6fd26fc9980374dac3a98bdc435/
MIT Licensed




Comments
Sign in to join the discussion.