🌍 Public
Bonus ICE
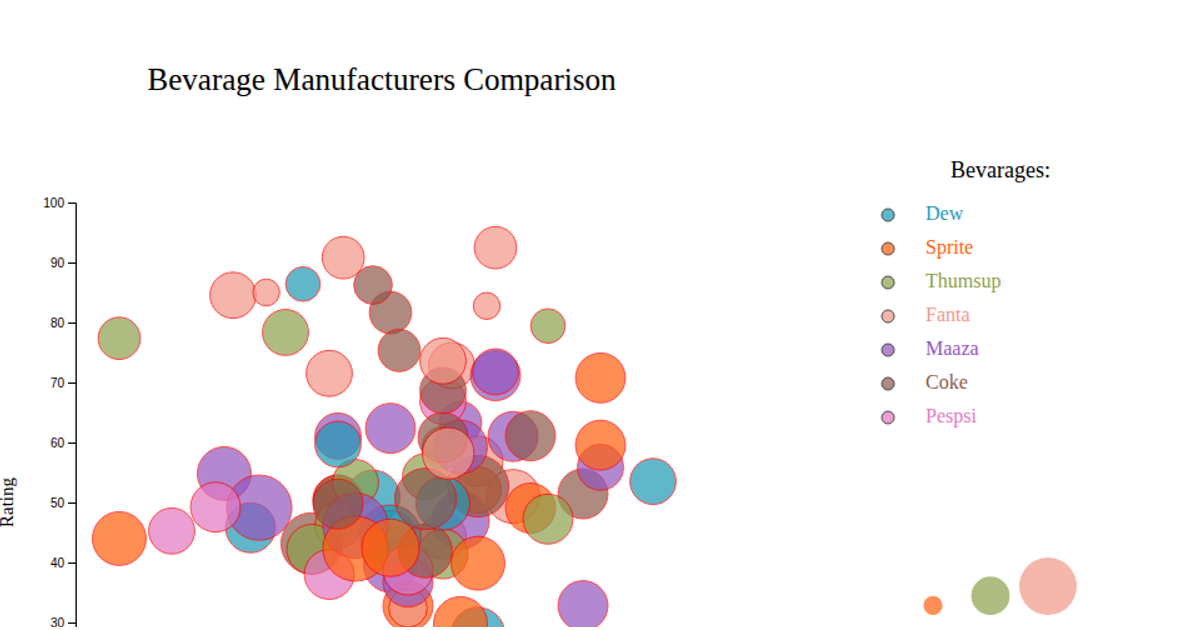
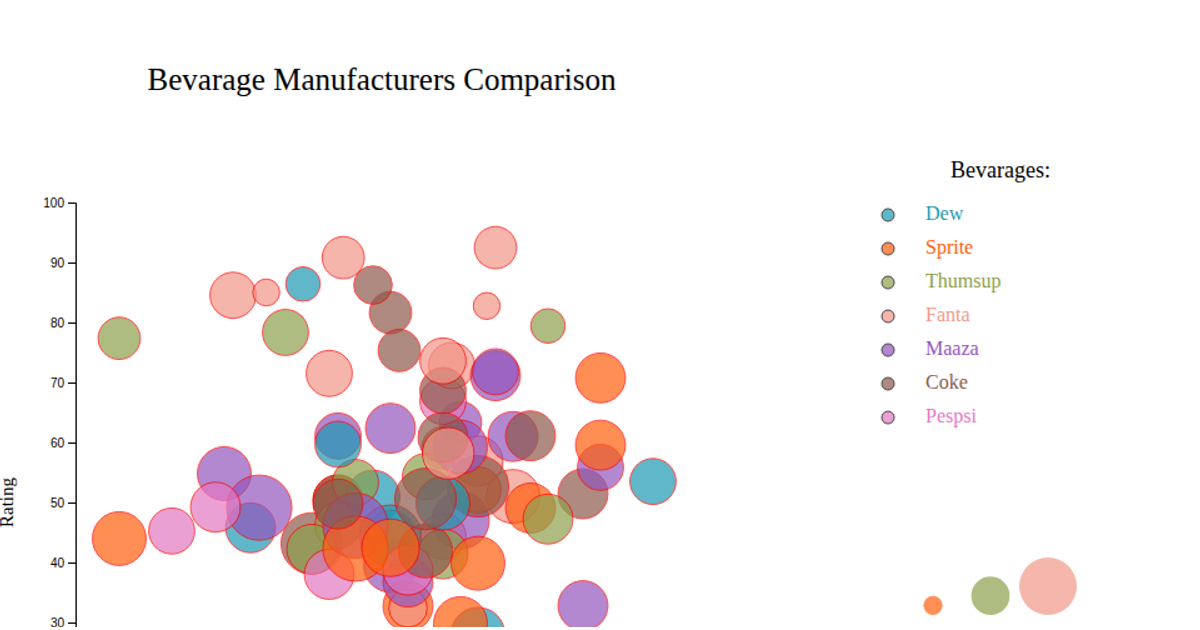
A bubble chart visualizes Baskin-Robbins ice cream flavors by calories on the y-axis and trans fat on the x-axis, with circle size encoding carbohydrate content and color distinguishing individual flavors. Hovering over a bubble displays a tooltip with the flavor name. The visualization uses d3.csv to load data and d3.scaleLinear for positioning and sizing, while d3.scaleOrdinal with d3.interpolateTurbo assigns colors. SVG circles, axis labels, a legend for carbohydrate values, and a color legend are rendered. The code follows the d3-graph-gallery bubble chart template.
AI-generated descriptionA bare minimum HTML page demonstrating use of CSS and JavaScript.
See also React Starter.
MIT Licensed



Comments
Sign in to join the discussion.