🌍 Public
Camera Max Resolution Vesus Price
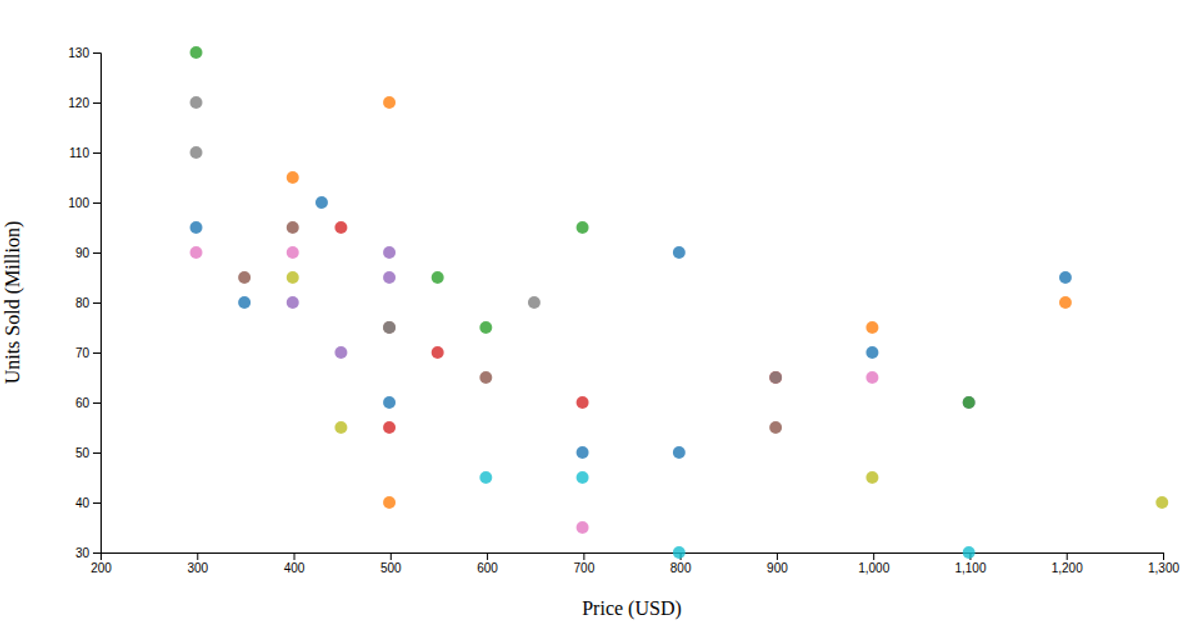
A scatter plot compares camera price and maximum resolution, using circular marks to reveal that no simple relationship exists between the two—many factors influence cost. The visualization, built with Vega-Lite API and D3, loads camera data from a GitHub CSV and encodes price on the x-axis, resolution on the y-axis, and model as color, with tooltips for details. The plot is rendered dynamically, filling the browser window.
AI-generated descriptionA visualization constructed using the vega-lite-api.
Result indicates there are no simple relationship between price and high resolution. there are many factor affecting price
dataset intro is at here
data is from camera dataset, which can be found here
MIT Licensed




Comments
Sign in to join the discussion.