🌍 Public
Corey's Bar Chart (from Simple Scatter Plot)
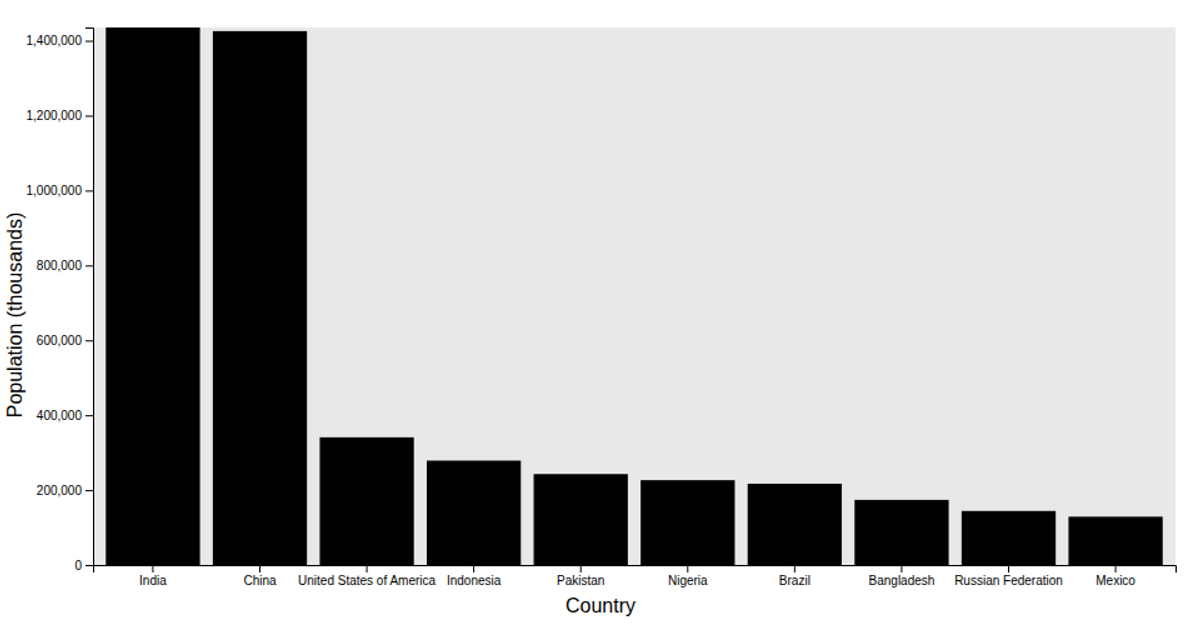
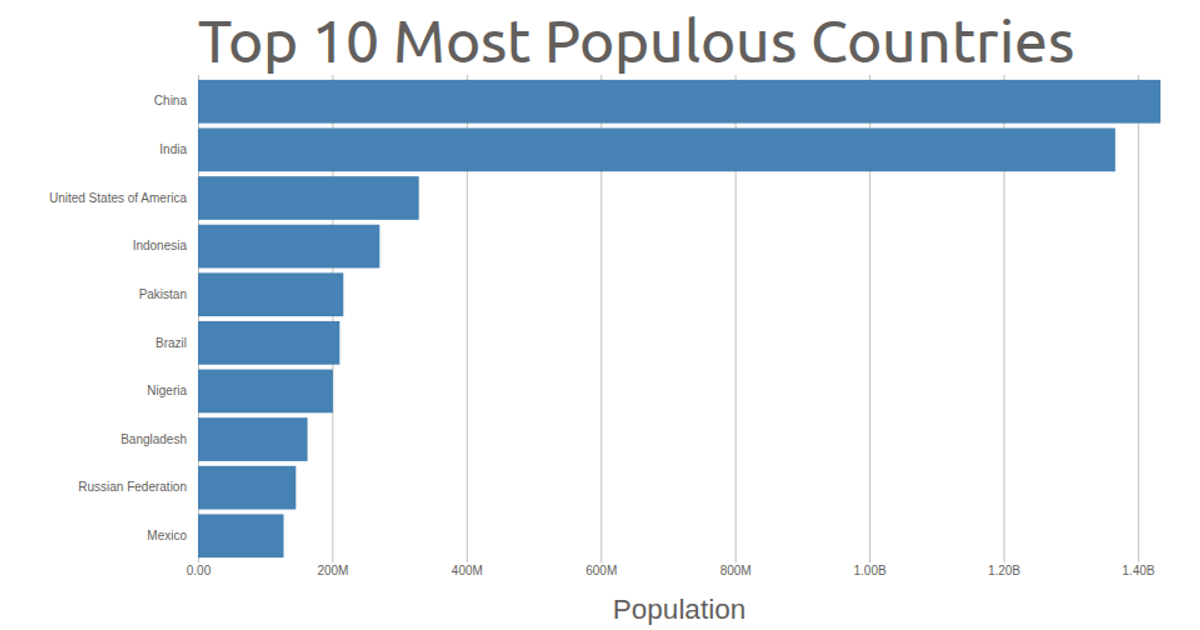
This bar chart visualizes the top 10 countries by total population using data from the UN Population Estimates 2024. The chart renders bars with a gray inner rectangle background, using D3's `scaleBand` and `scaleLinear`. The code filters the dataset for countries, sorts it in descending order, and slices the top 10 entries. It employs `axisLeft` and custom `xAxis`/`yAxis` functions, along with `xAxisLabel` and `yAxisLabel` utilities to label the axes.
AI-generated descriptionA simple scatter plot with D3 showing the Penguins Dataset.
Challenge
- Fork this viz
- Modify it to show your data
MIT Licensed




Comments
Sign in to join the discussion.