🌍 Public
Fork of HTML Starter
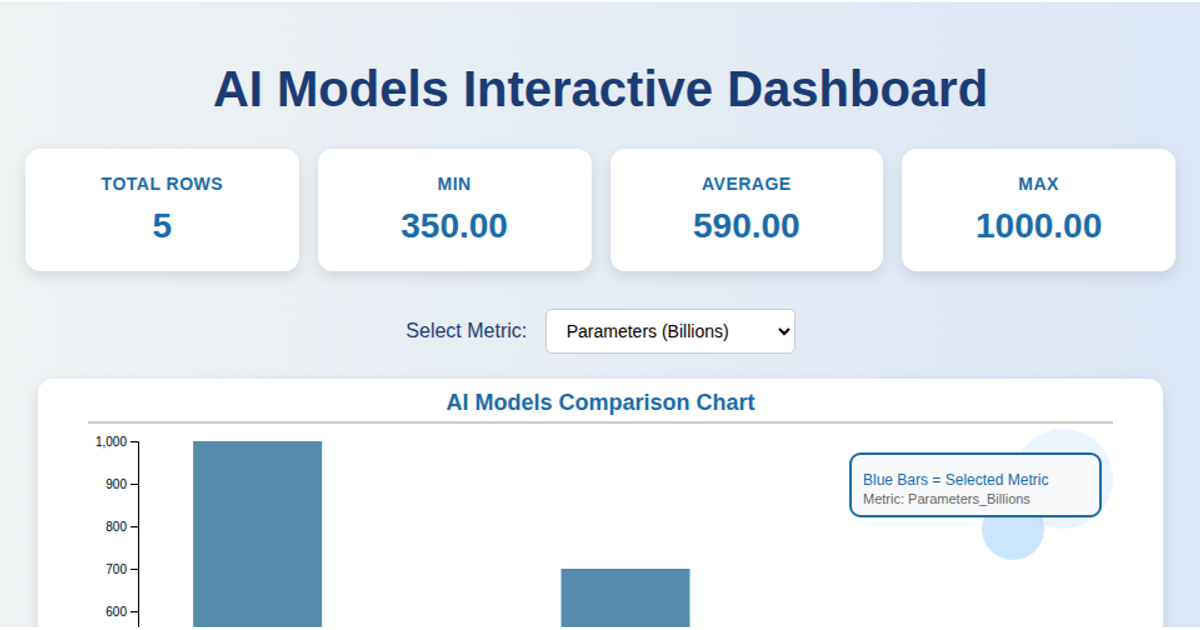
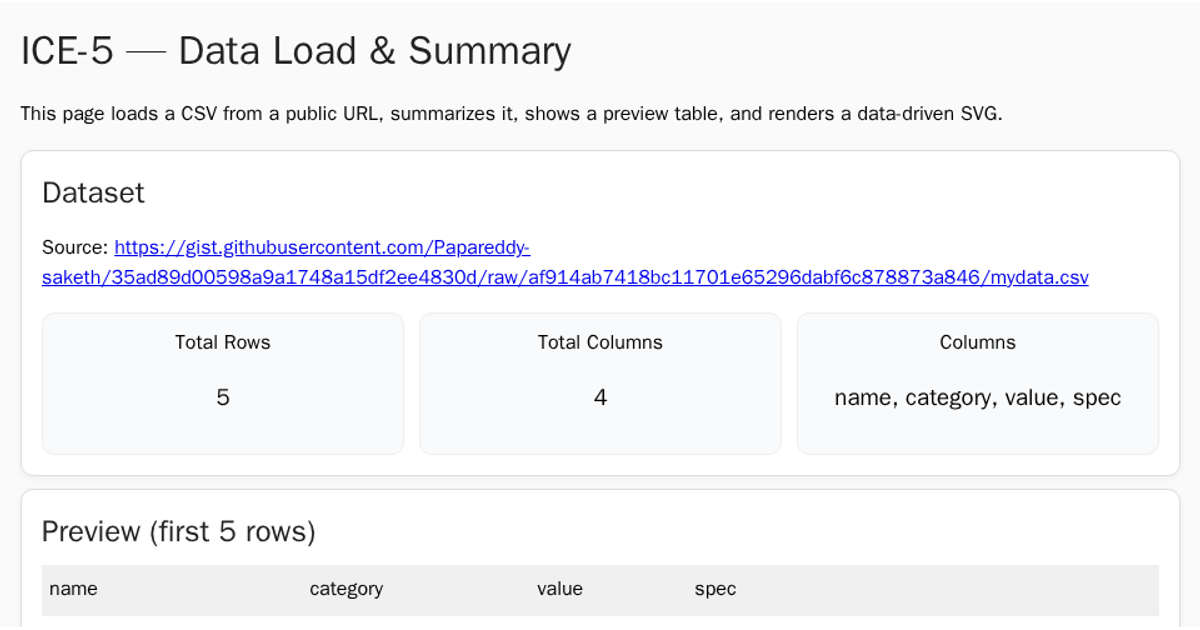
This interactive explorer shows how different visual encodings affect the interpretation of synthetic machine-learning configuration data, including training time, accuracy, and model size. Five toggleable versions demonstrate position, categorical hue, quantitative area, a deliberately broken encoding, and a repaired chart with an outlier highlight. The visualization uses D3 v7’s `d3.csv` to load data from a GitHub gist and renders SVG circles with color scales and size mappings. Highlighted features include ranking by model family and marking the highest-accuracy configuration, with data and code available under the MIT license.
AI-generated descriptionMIT Licensed





Comments
Sign in to join the discussion.