🌍 Public
dashboard dana anissa juliette filiz
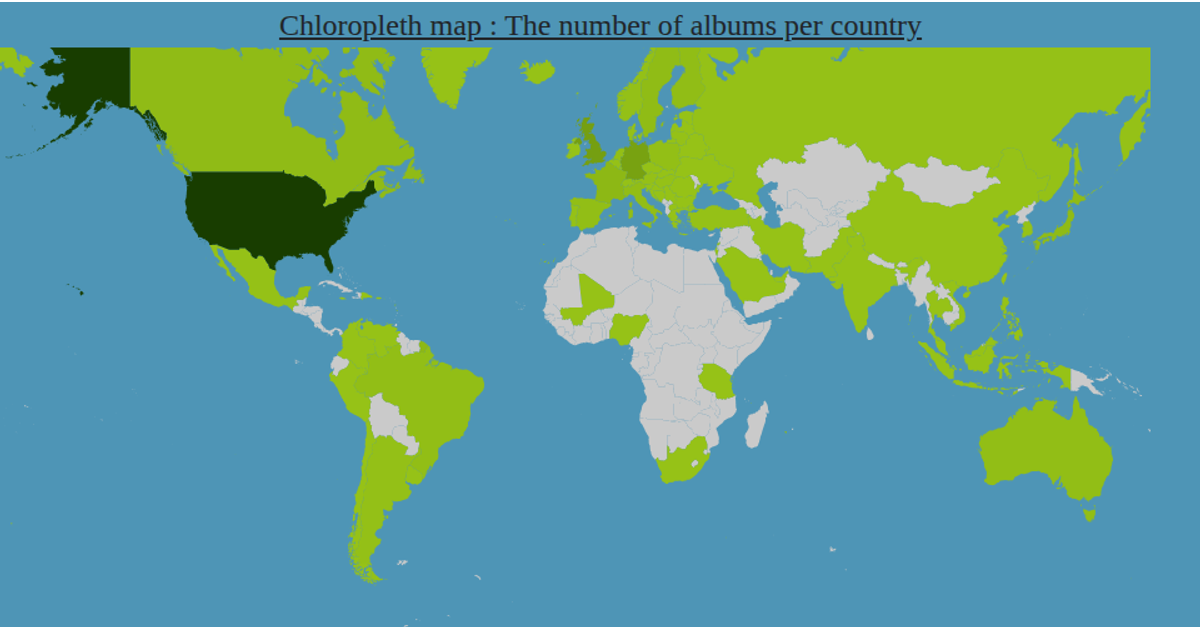
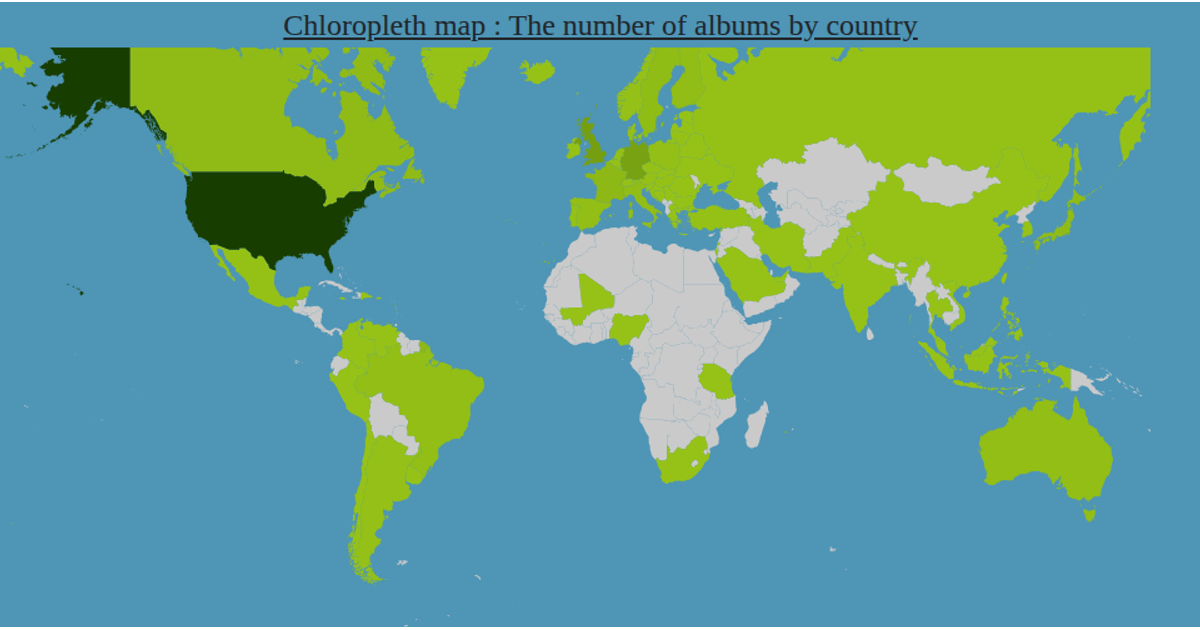
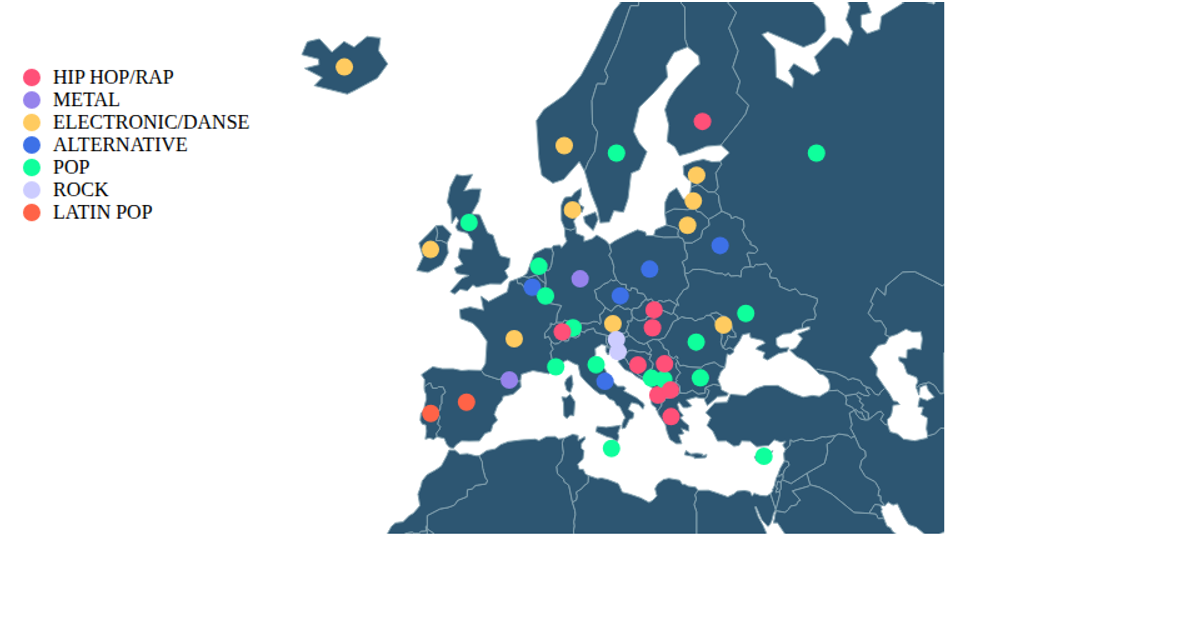
This dashboard presents a multi-view analysis of European music artists, combining a network visualization, a map, and supplementary charts. The central network uses `d3.forceSimulation` to map connections between an artist and their associated musical artists, with node interactions triggering updates. A geographic map rendered via `d3.geoPath` and `geoMercator` colors European countries by dominant genre, while tooltips and bar/circular charts display artist-specific data such as fan counts and languages, sourced from the Wasabi API and local JSON files.
AI-generated descriptionA demonstration of how to start using D3 version 6.
MIT Licensed





Comments
Sign in to join the discussion.