🌍 Public
Fork of Activity6_task2
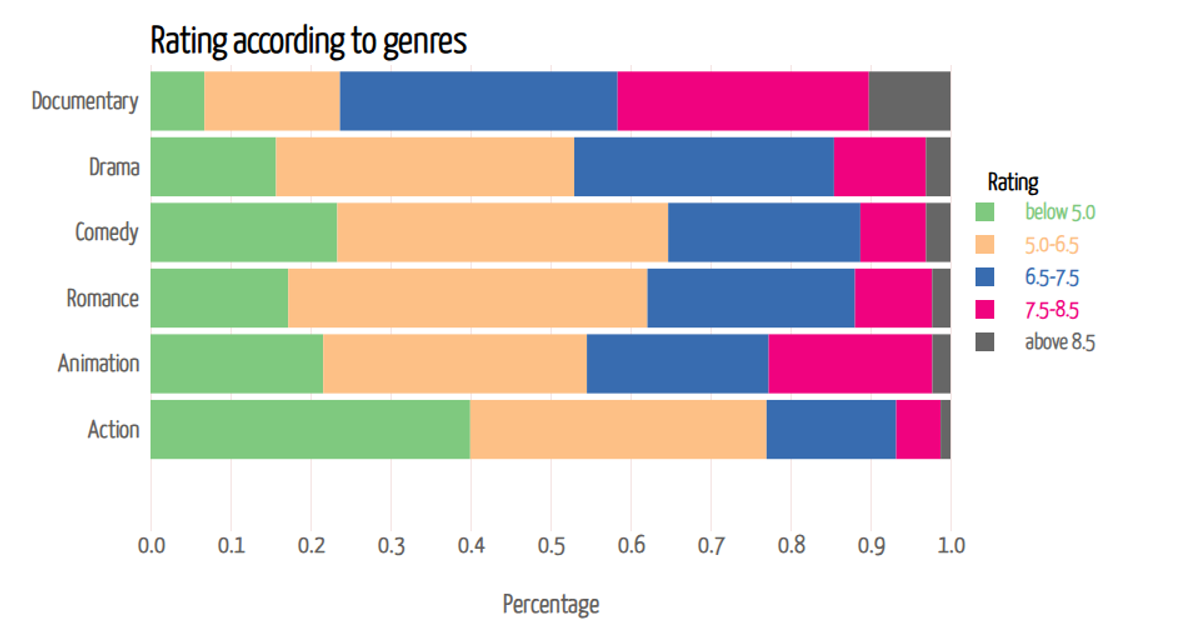
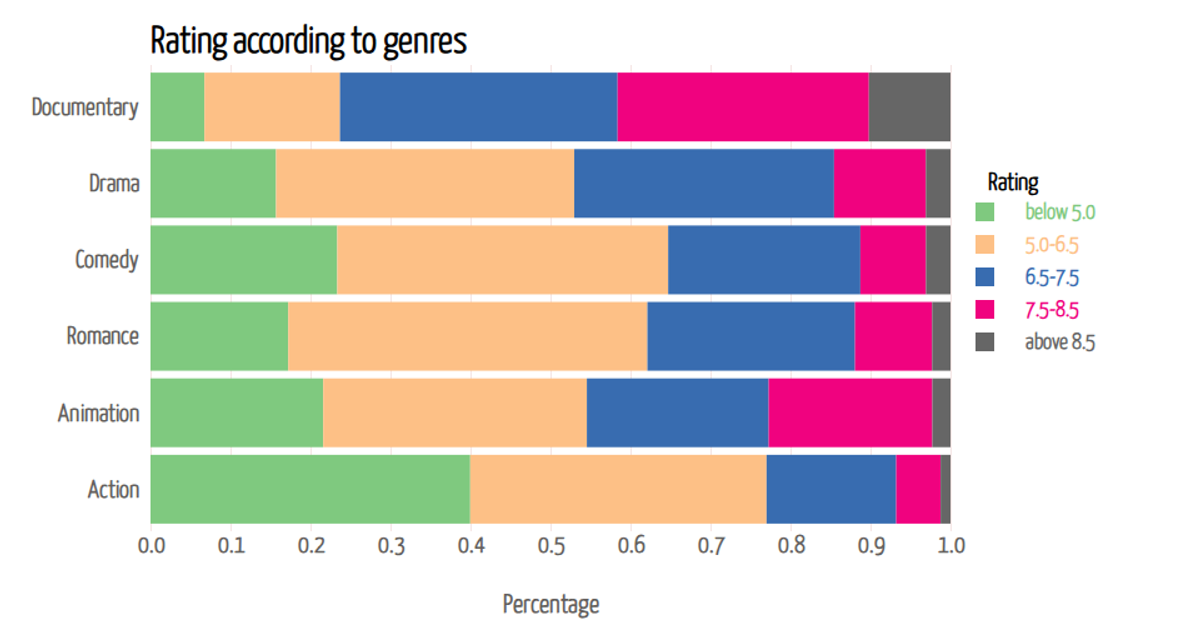
This example shows a static, precomputed stacked bar chart of IMDb-style rating distributions across six film genres, with ratings bucketed from “below 5.0” up to “above 8.5.” The data is loaded from a local CSV file. The code uses D3 v5’s `select` API to target DOM elements and demonstrates local ES6 module imports for modular message text. The provided files do not include code that renders the chart itself; only the data and a basic message display are present.
AI-generated descriptionAn example showing the capabilities of VizHub:
- Loads D3 via UNPKG.
- Demonstrates use of
importfrom"d3". - Demonstrates use of
importfrom local ES6 modules.
MIT Licensed





Comments
Sign in to join the discussion.