🌍 Public
Let's make a choropleth map with D3.js!
Iiascchwen
Last edited Nov 27, 2019
Created on Nov 27, 2019
Forked from Let's make an interactive map with D3.js!
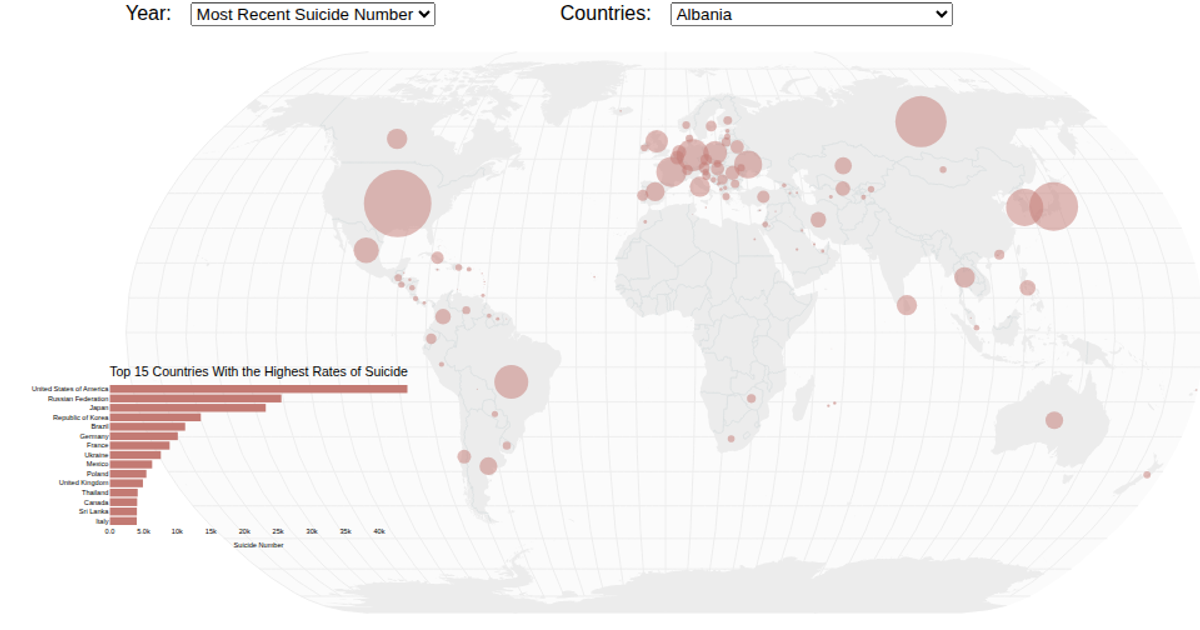
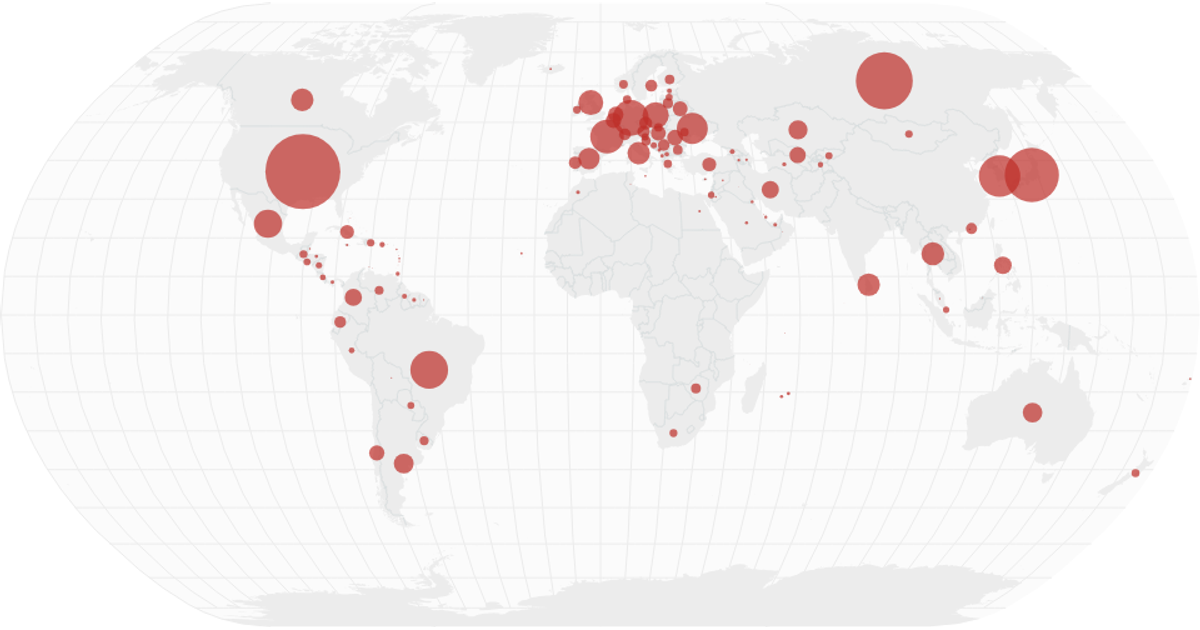
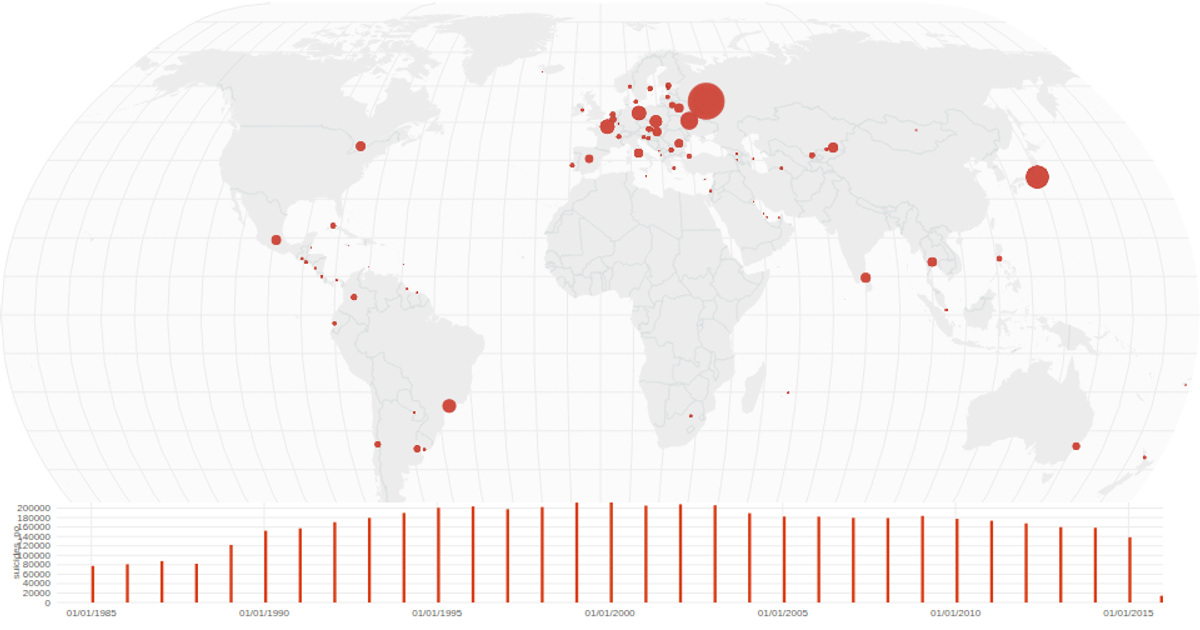
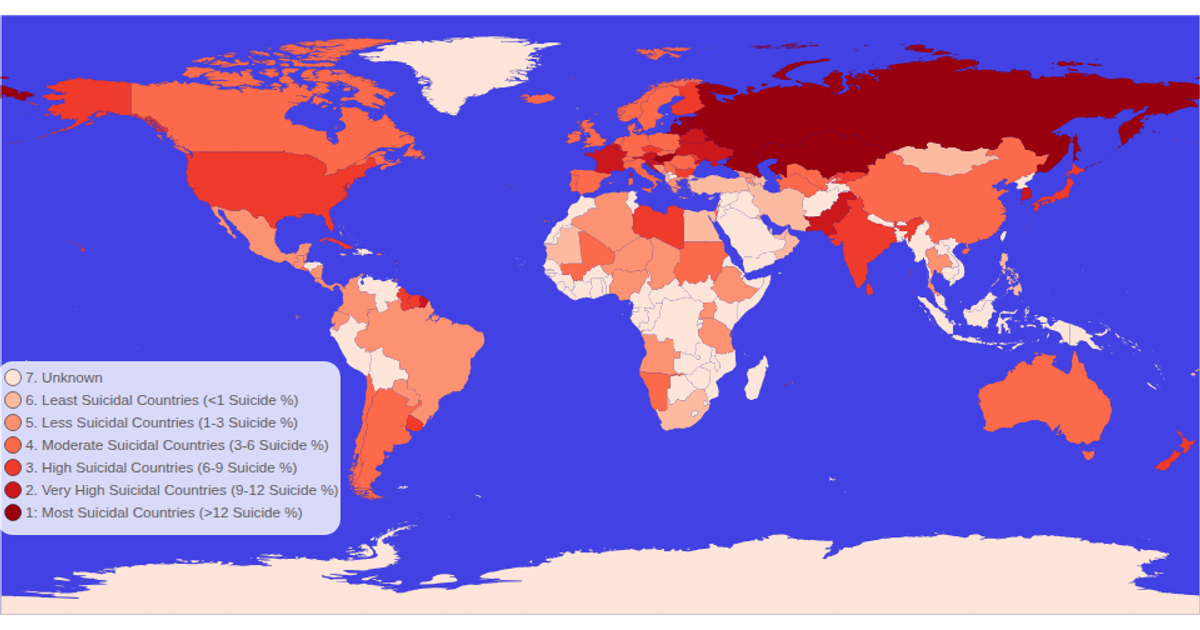
This choropleth map visualizes global suicide rates by country, with each nation colored and labeled to display its corresponding rate value across time. The map uses a Natural Earth projection rendered as SVG paths, with zoom and pan enabled through D3’s zoom behavior. Data is loaded from CSV and TopoJSON sources using d3.csv and d3.json, while d3.geoPath and the topojson feature method generate the country boundaries. Hovering highlights a country in red.
AI-generated descriptionMIT Licensed




Comments
Sign in to join the discussion.