🌍 Public
Animated and Stylized Bar Chart
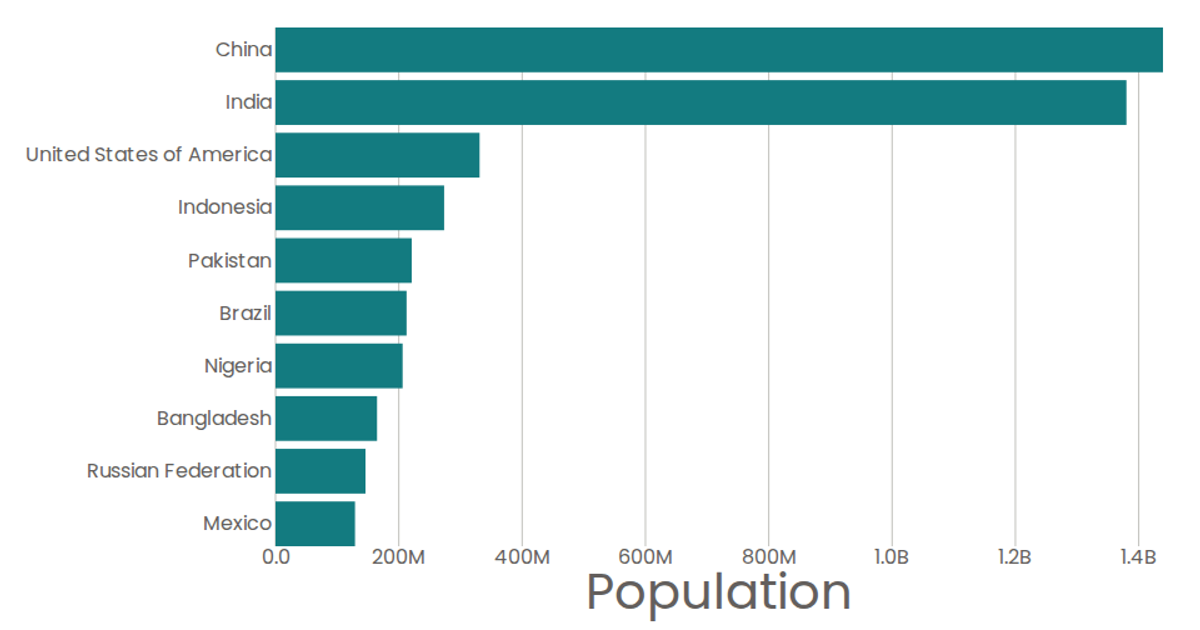
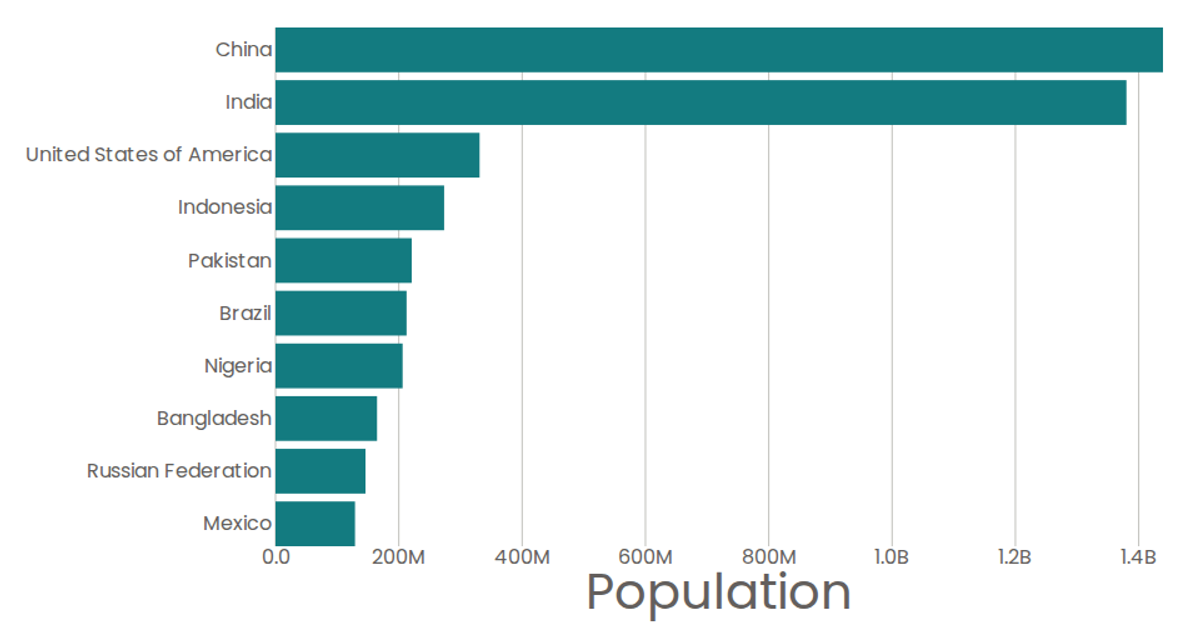
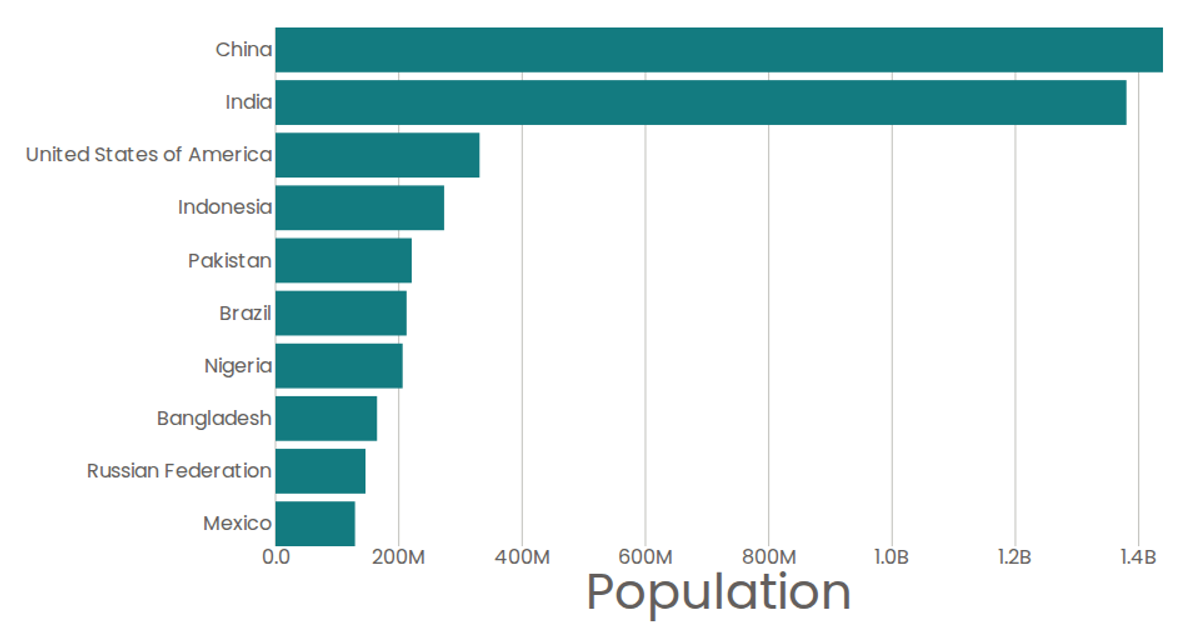
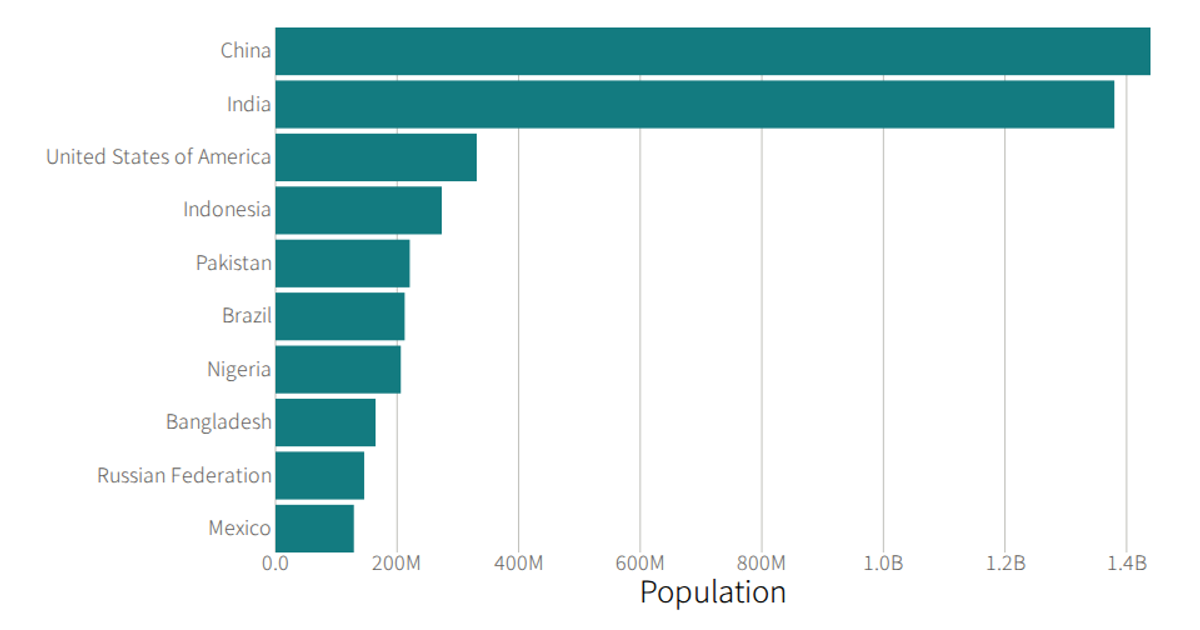
This visualization displays the top 10 most populous countries as an animated bar chart with a stylized, non-proportional aesthetic. Using React with D3 v5, the chart renders SVG bar marks via the `Marks` component and includes reusable `AxisBottom` and `AxisLeft` components. Moving the mouse triggers the `onMouseMove` handler, which randomly increments or decrements a `randomVal` state, subtly distorting each bar’s width. Data comes from the 2019 United Nations World Population Prospects, loaded via D3’s `csv` function, with populations scaled linearly and formatted using D3’s `format` utility.
AI-generated descriptionA program that shows the top 10 most populous countries as a bar chart.
MIT Licensed




Comments
Sign in to join the discussion.