🌍 Public
Make a Bar Chart with D3.jh
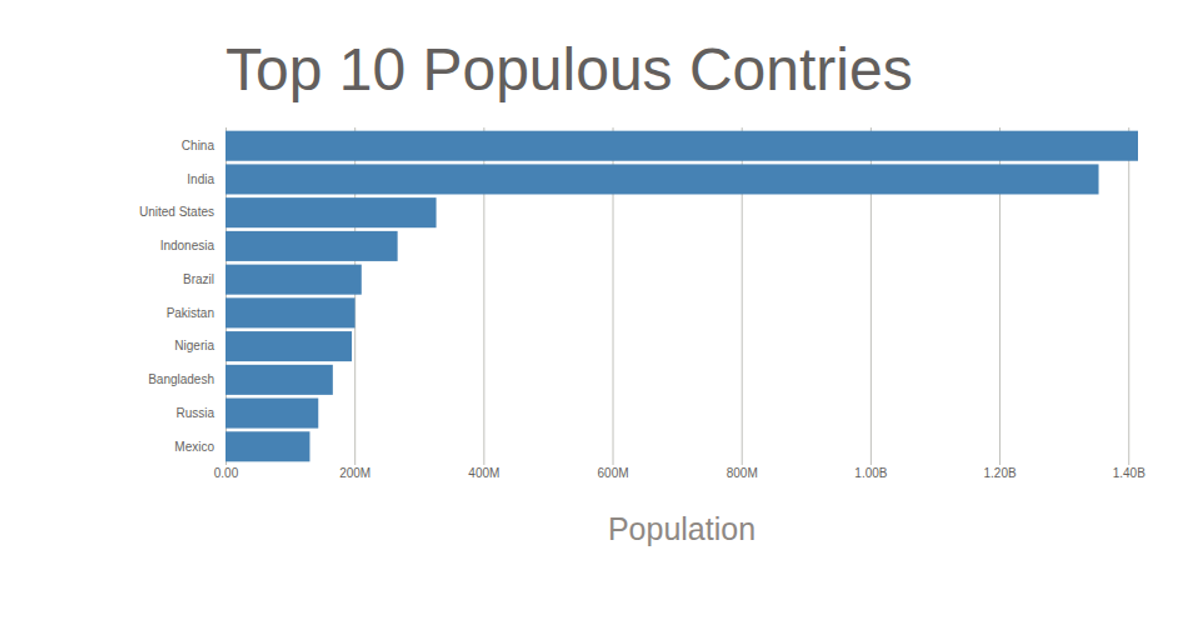
This bar chart displays the ten most populous countries using horizontal bars, with population values in thousands. The visualization is built with React and D3 v5, using `d3.csv` to load data from `data.csv`, `d3.scaleLinear` and `d3.scaleBand` for scaling, and `d3.axisLeft` and `d3.axisBottom` for axes. Country names appear on the left, bars in steel blue, and a labeled population axis at the bottom. SVG rendering is used throughout.
AI-generated descriptionReact Starter code.
MIT Licensed






Comments
Sign in to join the discussion.