🌍 Public
Temperature s in SF
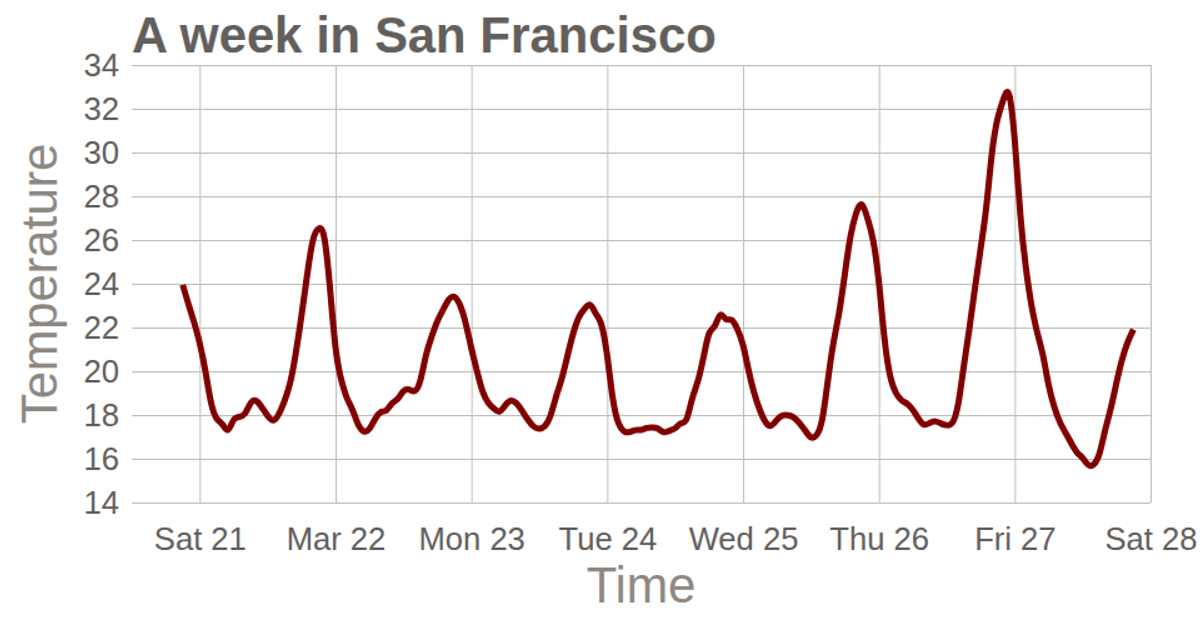
This visualization charts a week of hourly temperature readings in San Francisco, showing the daily warming and cooling cycles. The line chart plots temperature values against timestamps extracted from a CSV file, with the curve smoothed using D3’s `line` generator and `curveBasis` method. The SVG rendering uses D3 v5 scales, axes, and grid lines.
AI-generated descriptionMIT Licensed





Comments
Sign in to join the discussion.