🌍 Public
stacked bar char
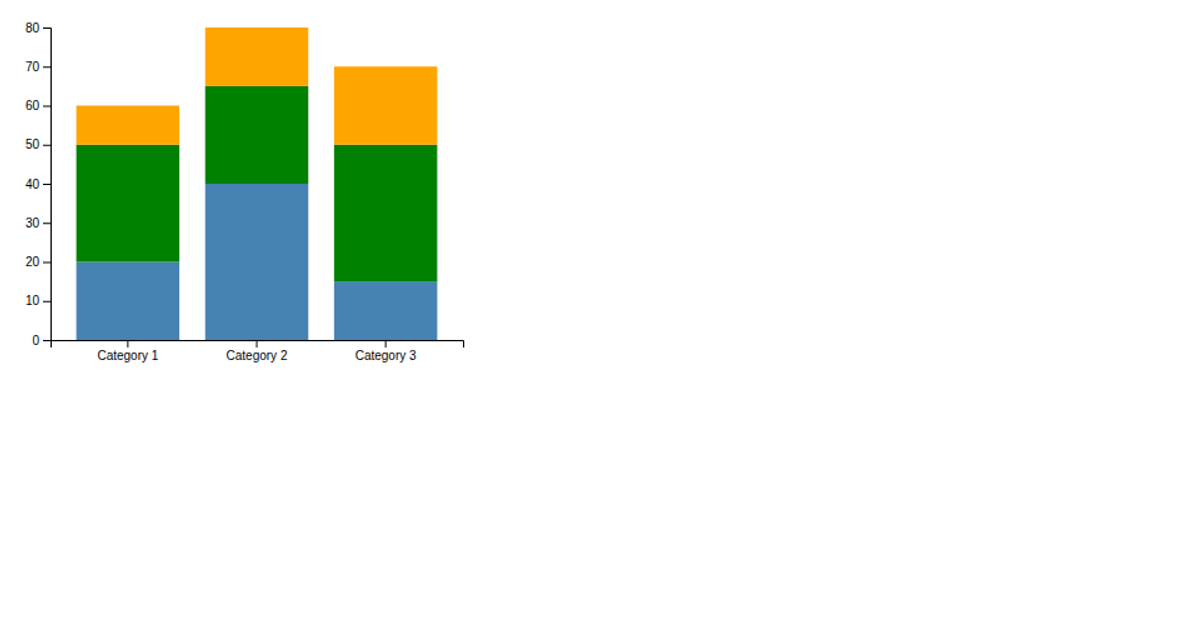
This example uses a stacked bar chart to visualize the number of Kickstarter campaigns across six price ranges, from under $1,000 to over $1 million, for each project category. The visualization is interactive, allowing users to toggle between stacked and grouped bar layouts via an HTML radio button, with smooth animated transitions between the two states. It is built with D3.js version 6.7.0, using `d3.csv` for data loading, `d3.layout.stack` for the stacking logic, `d3.scale.ordinal` and `d3.scale.linear` for axes, and `transition.attr` for the animated changes. The SVG rendering displays color-coded layers with a legend, rotated x-axis labels, and a tooltip on mouseover.
AI-generated descriptionMIT Licensed




Comments
Sign in to join the discussion.