🌍 Public
Lokesh Question 3
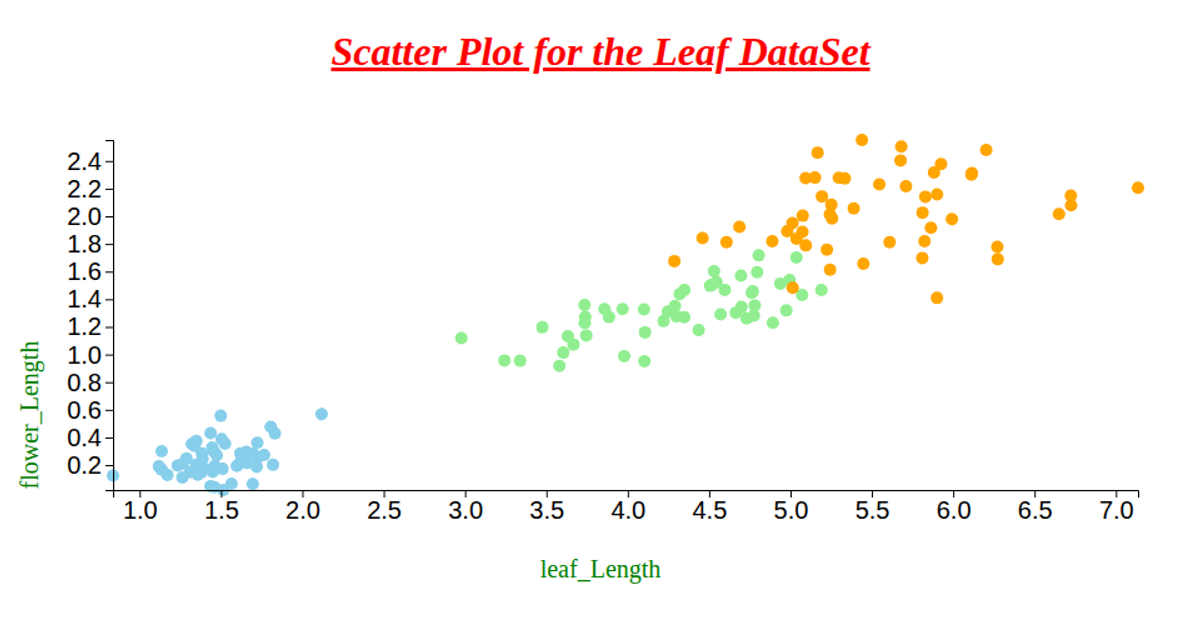
This scatter plot visualizes the Seeds dataset, comparing kernel length against kernel groove length across three wheat varieties. Points are rendered as distinct symbols using d3.symbol and symbolsFill, with a shape legend labeling each class. The visualization uses d3.scaleLinear for axes, d3.scaleOrdinal for shapes, and d3.csvParse to load data from a GitHub repository. Axes and legend components are built with d3.axisLeft, d3.axisBottom, and custom selection methods, all within d3.v7.
AI-generated descriptionWe are Displaying the Seeds dataset using Scatter plot.
MIT Licensed




Comments
Sign in to join the discussion.