🌍 Public
Fork of Rendering Data with React & D3
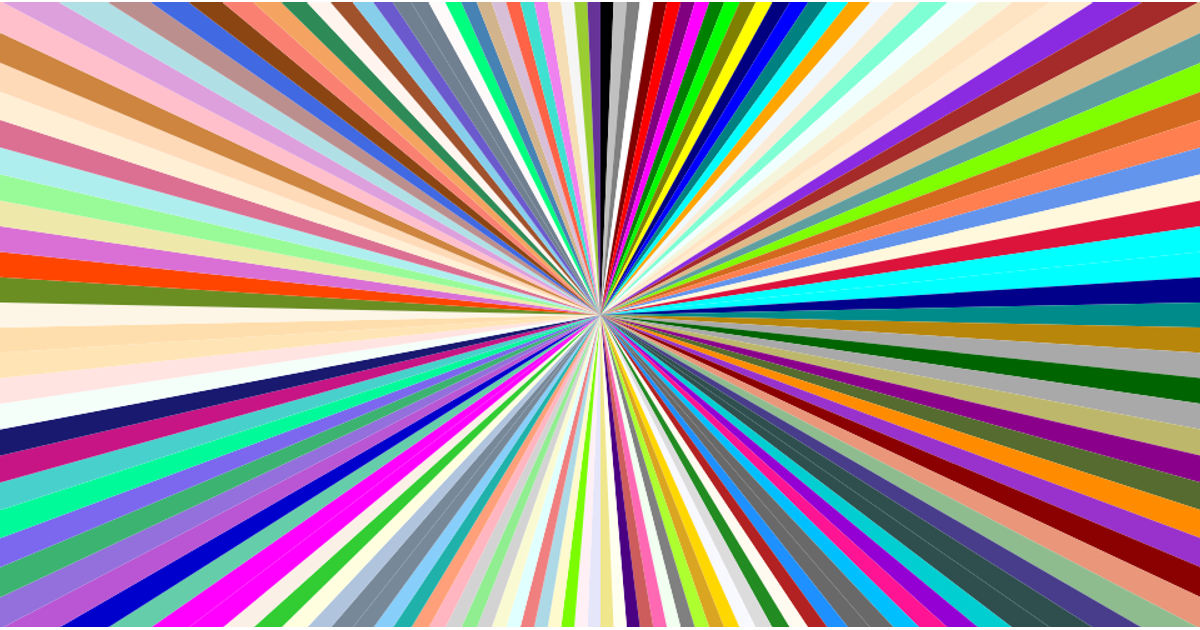
This example visualizes the CSS named color dataset as a radial burst of slices, each colored by its corresponding hex value. The data loads via `d3.csv` from a GitHub gist, then React renders the SVG paths. D3’s `pie` and `arc` utilities compute the slice angles and paths, while the colors come directly from the dataset’s `RGB hex value` column. The sort order is determined by parsing the hex number, creating a gradient-like sequence around the circle.
AI-generated descriptionA program that loads in some data about CSS named colors using D3 utilities, and uses React to render the data as a radial burst!
MIT Licensed



Comments
Sign in to join the discussion.