🌍 Public
Agent Performance over Time in Walker
CChrisKort
Last edited Oct 27, 2019
Created on Oct 24, 2019
Forked from Temperature in San Francisco Scatter Plot
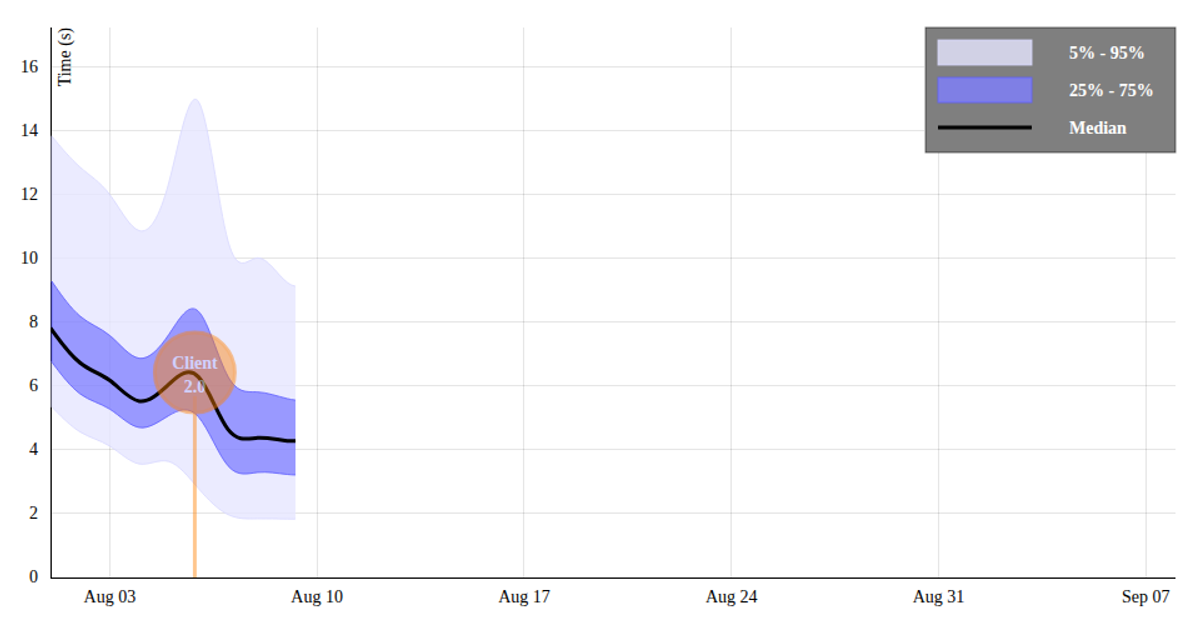
This visualization shows the performance of a Vanilla Policy Gradient (VPG) agent in the Walker environment over time, plotting performance against the number of interactions on a line chart. The chart includes axes with tick marks, axis labels, and a title, all rendered as SVG using D3 v5. The code uses `d3.csv` to load data from a VizHub-hosted dataset, `d3.scaleLinear` for both x and y axes, and `d3.line` with `curveBasis` to draw the smoothed line path. Data is parsed from CSV strings to numbers before rendering.
AI-generated descriptionMIT Licensed


Comments
Sign in to join the discussion.