🌍 Public
Q4ICE7
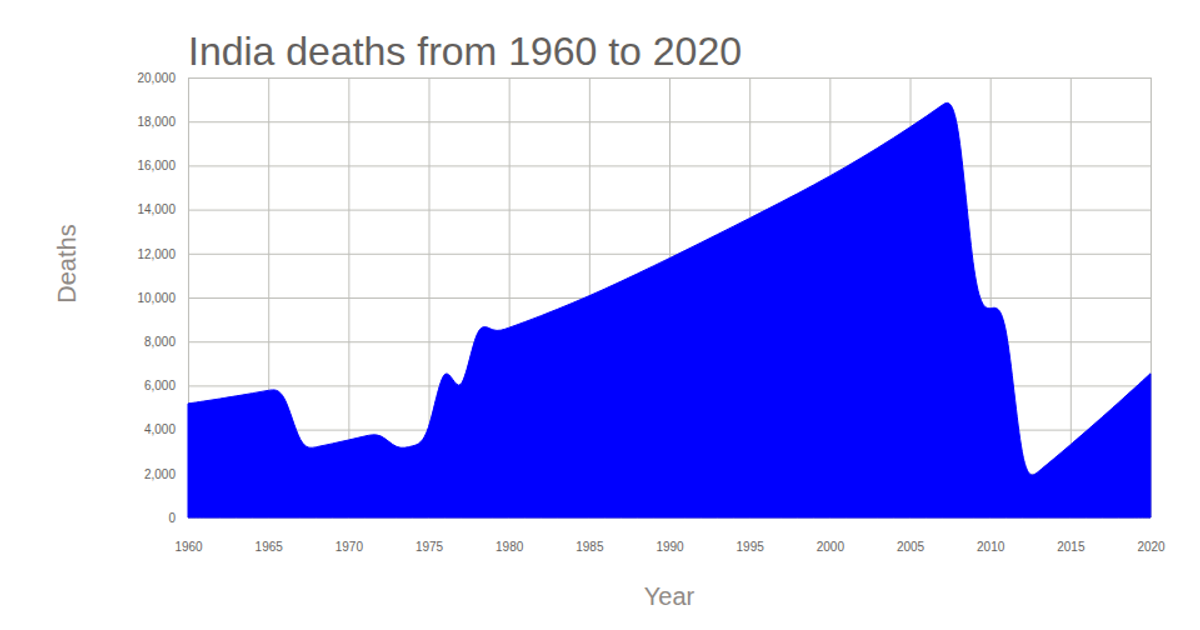
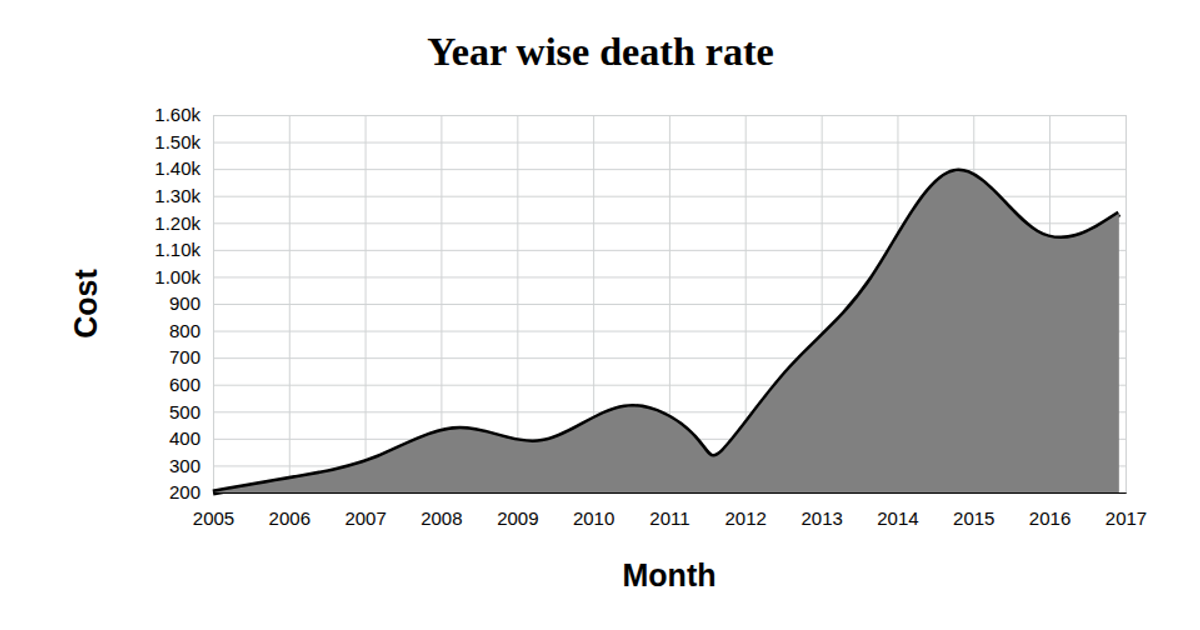
This chart visualizes the number of smallpox death cases each year between 1950 and 1970. A green area under a solid black line, rendered as SVG, shows the trend over time. The visualization uses D3 v5 to load and parse CSV data, apply linear scales for both axes, and generate the smoothed line and area paths using `line()`, `area()`, and `curveBasis()`. Axis components are built with `axisBottom()` and `axisLeft()`.
AI-generated descriptionA bare minimum HTML page demonstrating use of CSS and JavaScript.
See also React Starter.
MIT Licensed





Comments
Sign in to join the discussion.