🌍 Public
Fork of Multiple Views with Brushing
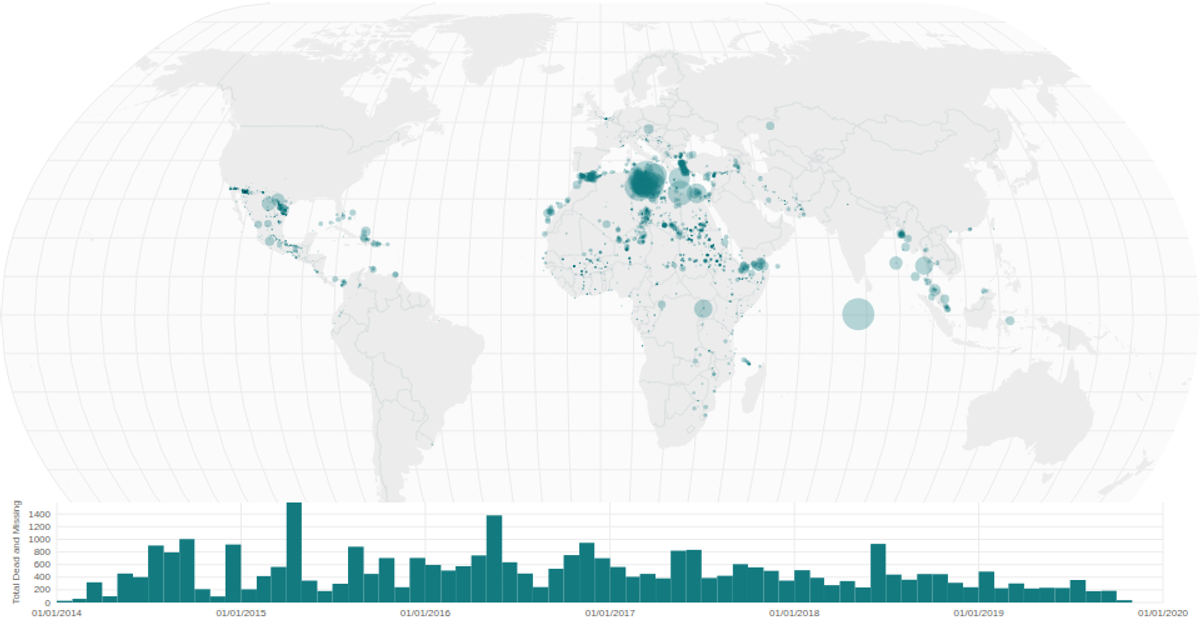
A world map of coffee bean exports uses a linked DateHistogram to filter cities by year through brush-driven interaction. The BubbleMap renders d3.geoNaturalEarth1 projections with d3.geoPath for country boundaries and graticules, while circles scale by export value. The DateHistogram bins data by month using d3.bin and d3.timeMonths, with d3.brushX enabling temporal selection that filters the map in real time. Data comes from a CSV via d3.csv, with world atlas geometries from topojson.
AI-generated descriptionA world map showing cities with population greater than 50,000. City data from Simplemaps: World Cities Database.
Country boundaries from World Atlas TopoJSON, polished for visual style, including graticules.
MIT Licensed


Comments
Sign in to join the discussion.